- NZD/USD keeps recovery moves from 0.6755 despite Friday’s bearish candlestick.
- The 0.6700 threshold, 21-day SMA offer immediate support.
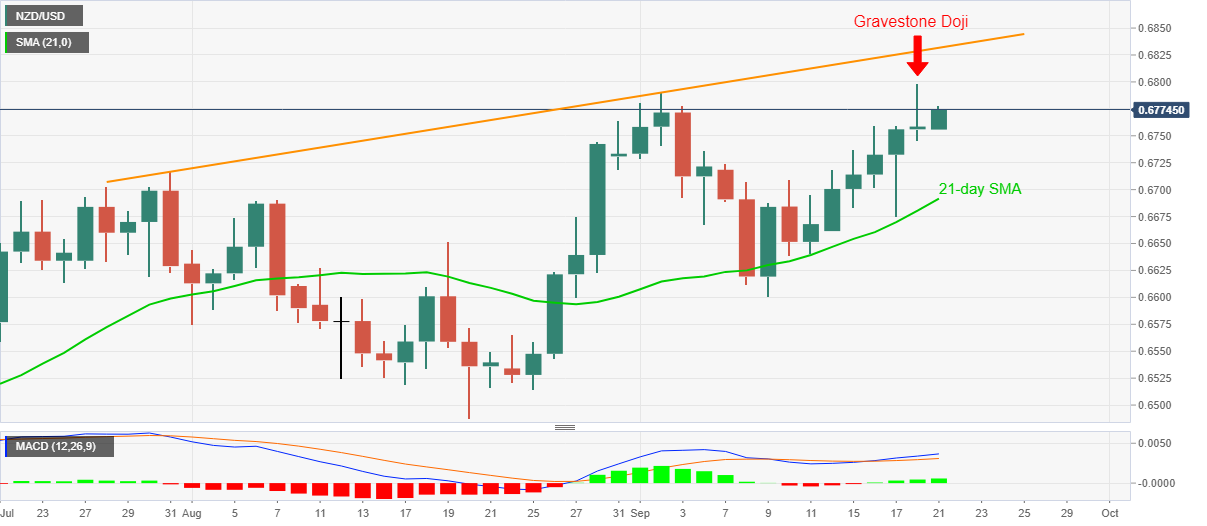
- A seven-week-old resistance line can lure the buyers before latest highs.
NZD/USD takes the bids near 0.6775, up 0.23% on a day, during the early Monday. In doing so, the kiwi pair defies Friday’s bearish candlestick formation amid bullish MACD.
However, buyers will remain cautious unless the pair crosses the latest top near 0.6800, a break of which will direct NZD/USD towards an ascending trend line from July 31, at 0.6831 now.
In a case where the bulls remain dominant past-0.6830, April 2019 top near 0.6840 and the 0.6900 may return to the charts.
Alternatively, 0.6700 and 21-day SMA level of 0.6691 can restrict the near-term downside of NZD/USD.
During the pair’s additional weakness below 0.6691, the monthly bottom surrounding 0.6600 should be the key to watch.
NZD/USD daily chart
Trend: Pullback expected
