- NZD/USD bounces off intraday low, actually one week bottom, of 0.6575.
- Sustained trading below the key Fibonacci retracement level joins bearish MACD signals to favor sellers.
- Seven-week-old ascending trend line lures the bears, 0.6655/60 becomes the key upside hurdle.
NZD/USD retraces from a weekly trough towards regaining the 0.6600 threshold during early Wednesday. The pair marked heaviest losses in over two weeks after confirming the multi-top breakdown the previous day.
Also suggesting the quote’s further downside is the bearish MACD signals and a sustained break below 61.8% Fibonacci retracement of August-September upside.
As a result, sellers are currently directed towards the August 24 top near 0.6565 ahead of an ascending trend line from August 20, at 0.6518 now.
Additionally, the 0.6500 round-figure and the August month’s low of 0.6488 can lure the NZD/USD bears if the prices remain soft under the 0.6518.
Alternatively, the 61.8% Fibonacci retracement level of 0.6606 and the horizontal resistance, previous support, around 0.6615, can tame the pair’s short-term advances.
Though, buyers will have to remain cautious unless breaking 0.6655/60 resistance confluence including 200-bar SMA and multiple tops marked since October’s start.
NZD/USD four-hour chart
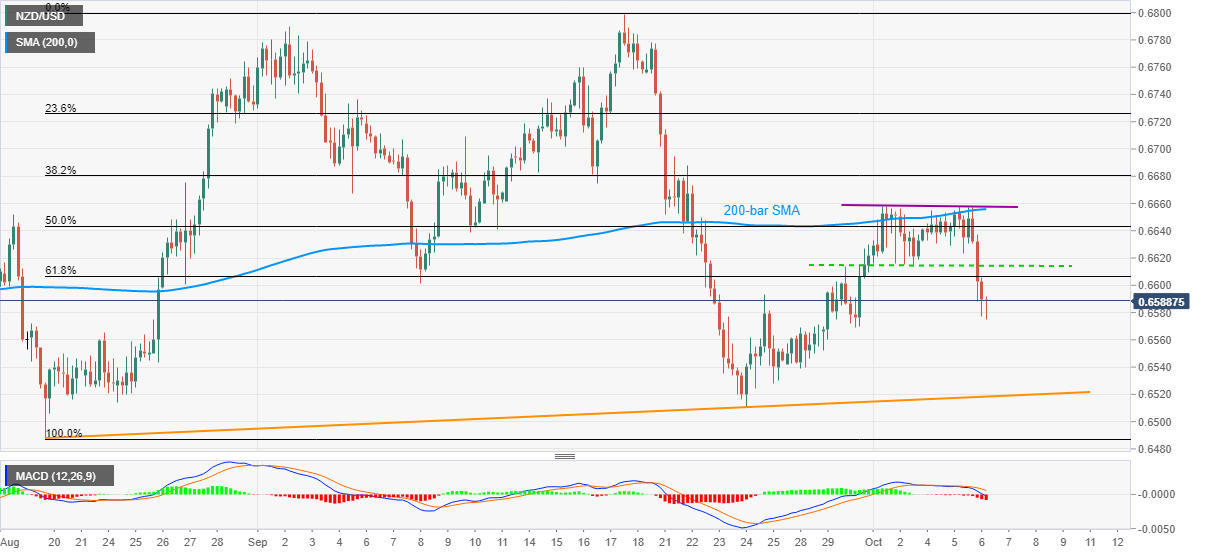
Trend: Bearish
