Gold is in demand as markets are cheering the growing chances of a decisive US election, where Democratic Joe Biden comes on top within hours or days rather than seeing a protracted legal process. Moreover, Republicans – on course to retain the Senate – seem more willing to support a new stimulus package.
After the recent rise, how is the precious metal positioned on the technical charts?
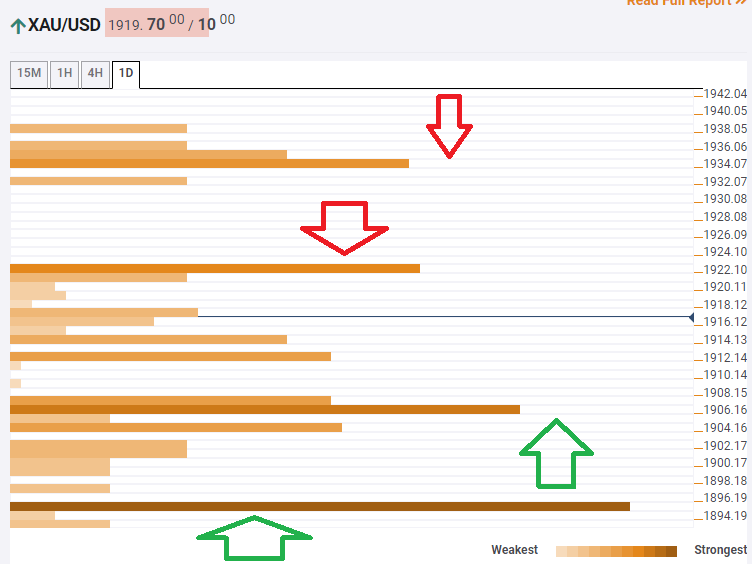
The Technical Confluences Indicator is showing that the next hurdle awaits $1,922, which is the convergence of the Pivot Point one-month Resistance 1 and the Bollinger Band 15min-Upper.
The next hurdle is $1,934, which is the meeting point of the previous monthly high and the Pivot Point one-week Resistance 2.
Looking down, support awaits at $1,906, which is the confluence of the Simple Moving Average 100-15m, the Fibonacci 61.8% one-month, and other lines.
Strong support is at $1,895, which is the meeting point of the BB 1h-Lower, the SMA 100-1h, the SMA 10-one-day, the SMA 100-one day, and the Fibonacci 38.2% one-day.
Key XAU/USD resistances and supports
Confluence Detector
The Confluence Detector finds exciting opportunities using Technical Confluences. The TC is a tool to locate and point out those price levels where there is a congestion of indicators, moving averages, Fibonacci levels, Pivot Points, etc. Knowing where these congestion points are located is very useful for the trader, and can be used as a basis for different strategies.
Learn more about Technical Confluence
