- DXY’s upside momentum falters in the 93.30 region so far.
- The 6-month support line looks to hold initial bearish moves.
DXY seems to have met quite a tough barrier in the 93.30 zone for the time being.
That said, if the index manages to leave behind this area, ideally in the very near-term, then the door should open to a probable visit to so far monthly peaks around 94.30 (November 4). Further rangebound and a potential resumption of the bearish note should not be ruled out otherwise.
Further out, as long as DXY trades below the 200-day SMA, today at 96.40, the negative view is forecast to persist.
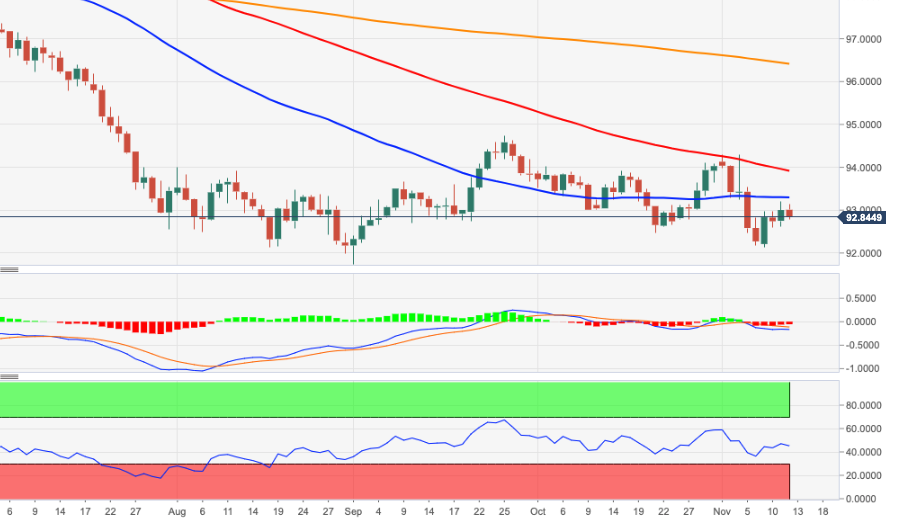
DXY daily chart