- DXY drops below the 93.00 mark following CPI results.
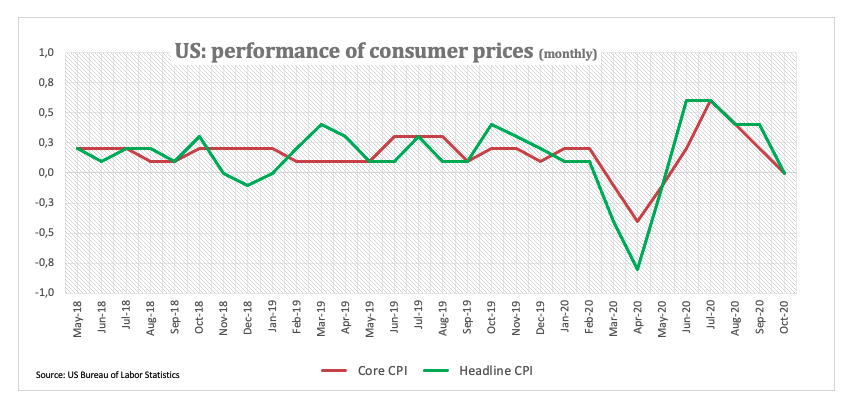
- US headline, core CPI came in flat MoM in October.
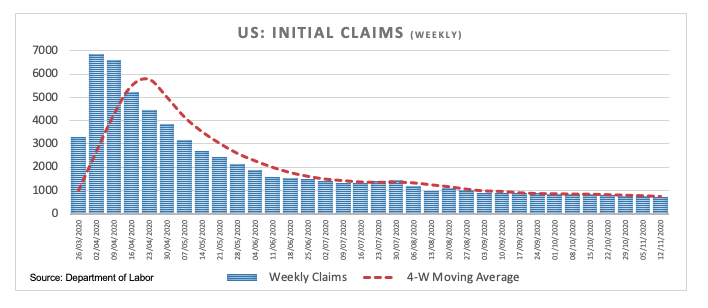
- US Initial Claims rose by 709K WoW, bettering expectations.
The US Dollar Index (DXY), which tracks the buck vs. a bundle of its main rivals, trades slightly into the negative territory below the 93.00 mark on Thursday.
US Dollar Index struggles for direction ahead of Powell
The index fades the earlier spike to the area beyond 93.00 the figure amidst alternating risk appetite trends and always against the backdrop of a generalized cautious stance as traders gauge the advance of the pandemic vs. the potential vaccine candidates.
Furthermore, the dollar remains unable to pick up further upside traction after US inflation figures failed to meet expectations in October, with both the headline CPI and the core gauge showed flat readings on a monthly basis.
On a brighter spot, weekly Claims rose by 709K, surpassing consensus and re-confirming the downtrend observed since early April.
Later in the NA session, Chief Powell will share an online discussion panel with ECB’s Lagarde and BoE’s Bailey, all under the ECB Forum on Central Banking.
What to look for around USD
DXY’s recovery appears so far capped by the 93.30 area. In the meantime, the dollar remains focused on the US post-elections scenario, where all the looks are upon (still) President Trump and his potential attempts to contest some results in several states. On the more macro view, the impact of the second wave of the pandemic on the global economy could favour the occasional re-emergence of the risk aversion and therefore lend some support to the buck, while extra progress regarding vaccines against the COVID-19 should support momentum in the risk complex. Further out, the “lower for longer” stance from the Federal Reserve is expected to keep limiting potential serious upside in DXY.
US Dollar Index relevant levels
At the moment, the index is losing 0.15% at 92.85 and faces immediate contention at 92.13 (monthly low Nov.9) followed by 91.92 (23.6% Fibo of the 2017-2018 drop) and then 91.80 (monthly low May 2018). On the other hand, a breakout of 92.97 (monthly high Nov.10) would open the door to 93.29 (55-day SMA) and finally 94.30 (monthly high Nov.4).
