- GBP/USD struggles to recover from one-week low despite bullish MACD.
- Two-month-old rising trend line offers key upside hurdle.
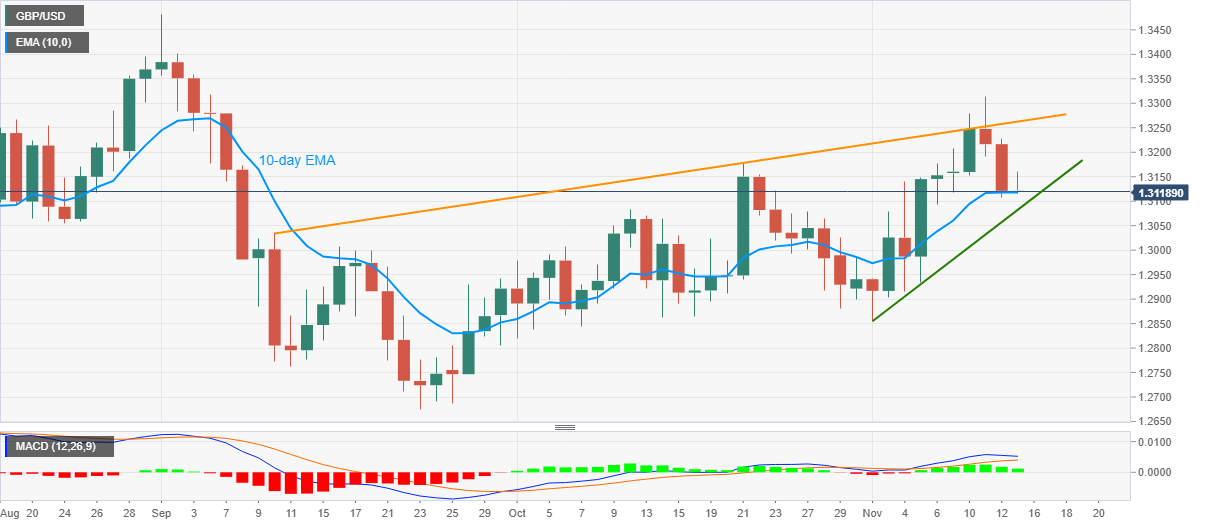
GBP/USD sellers catch a breather around 1.3123 during Friday’s Asian session. The cable refreshed weekly bottom the previous day before recently bouncing off 1.3106.
While 10-day EMA stopped the pair’s further downside amid bullish MACD, the recovery moves are less likely to convince the bulls unless the quote rises past an upward sloping resistance line from September 10, at 1.3262 now.
Though, additional pullback moves toward October’s high near 1.3175 and then to the 1.3200 threshold can’t be ruled out.
Should GBP/USD bulls conquer 1.3262 on a daily closing basis, they will rush to refresh the monthly high of 1.3313.
Alternatively, a daily close past-10-day EMA level of 1.3118 will drag the pair further down to an ascending support line from November 02, currently near 1.3080.
In a case where the GBP/USD bears dominate past-1.3080, the 1.3000 psychological magnet and the monthly low around 1.2850 may regain market attention.
GBP/USD daily chart
Trend: Further weakness expected
