- USD/CAD flirts with 1.3100, keeps corrective pullback from short-term SMA.
- Normal RSI conditions, strong SMA support suggest further recovery.
- 200-bar SMA adds to the upside filters, 1.3000 threshold also challenges the bears.
USD/CAD wobbles around 1.3100 during the initial Asian session on Wednesday. The pair recently recovered from 50-bar SMA amid normal RSI conditions, which in turn suggest further corrective pullback towards a falling trend line from November 04.
Other than the stated resistance line near 1.3135, 200-bar SMA around 1.3165 also challenges the USD/CAD buyers ahead of pushing them towards the 1.3200 round-figure.
Further, the 61.8% Fibonacci retracement level of October 29 to November 09 downside, close to 1.3215, offers an extra resistance to watch for the buyers.
Meanwhile, a downside break below the 50-bar SMA level of 1.3070 will direct USD/CAD sellers towards the 1.3000 psychological magnet before highlighting 1.2960 support.
Though, any further weakness past-1.2960 will not refrain from challenging the monthly low of 1.2928.
USD/CAD four-hour chart
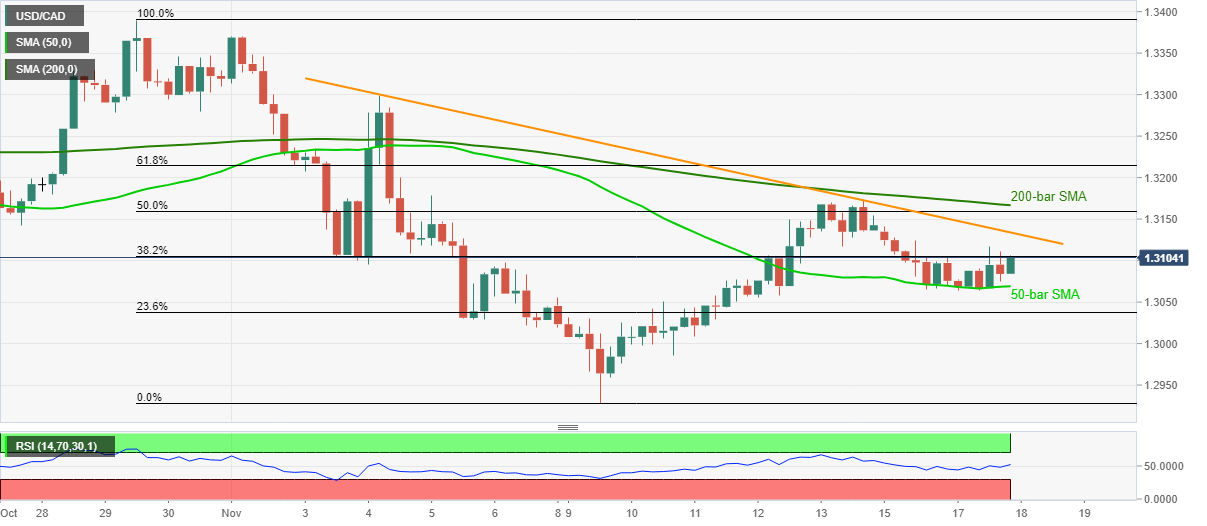
Trend: Further recovery expected
