- Silver prices print three-day downtrend while testing fresh one-week low.
- Normal RSI conditions favor sellers targeting an ascending trend line from September 24.
- A short-term falling trend line adds to the upside filters.
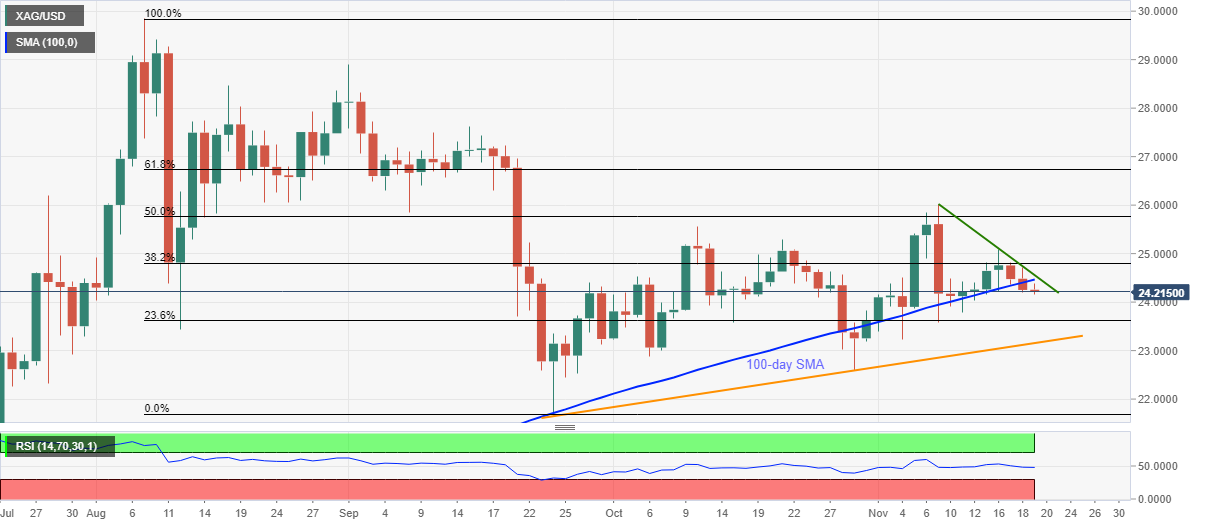
Silver drops to $24.20 while failing to keep the bounce off intraday low of $24.15 during the early Thursday. In doing so, the white metal prints 0.15% losses on a day (D1) after closing below 100-day SMA for the first time since late-October.
Normal RSI conditions back the downside break of the key SMA to keep the silver sellers hopeful.
That said, the $24.00 threshold can offer immediate support ahead of directing the commodity bears towards a multi-day-old support line, at $23.15 now.
Should the metal fails to recover from $23.15, lows marked during the late-September and October 29, near $22.60, can offer intermediate halts before recalling September’s bottom around $21.65.
On the flip side, a clear break above the 100-day SMA level of $24.65 needs to cross a falling trend line from November 09, at $24.55 now, to recall the short-term buyers.
Silver daily chart
Trend: Bearish
