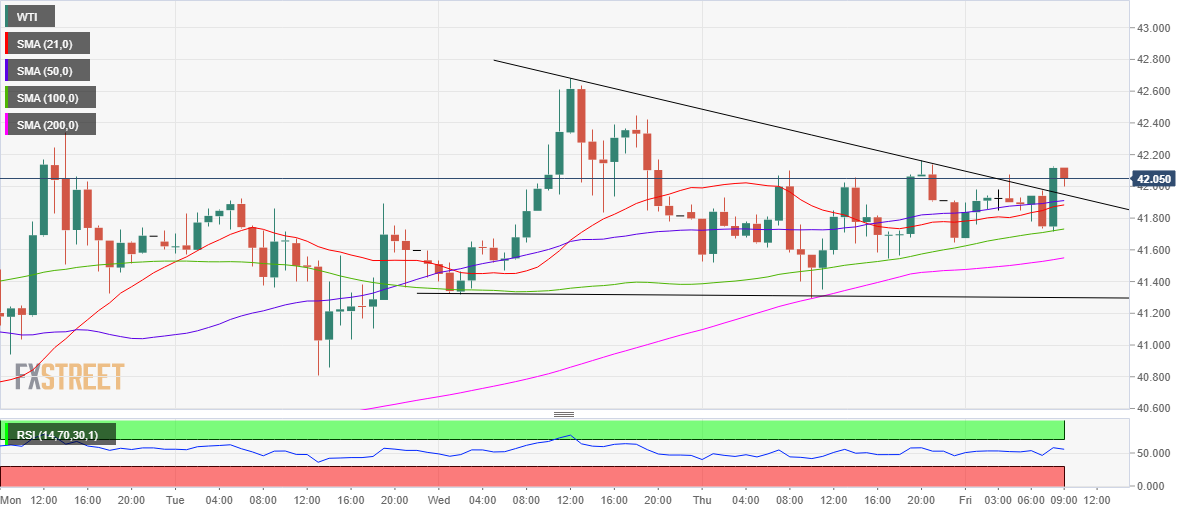
- WTI looks to extend gains above the $42 mark.
- Descending triangle breakout confirmed on the hourly chart.
- 100-HMA at $41.73 offers powerful support.
WTI (futures on NYMEX) is back on the bids above the $42 mark, heading towards multi-day highs of $42.68 despite the risk-off market mood.
Concerns surrounding the covid growth worldwide and Fed-Treasury clash weigh on the investors’ sentiment.
From a technical perspective, the black gold has confirmed a descending triangle breakout on the hourly chart after closing the last hour above the falling trendline resistance at $41.96.
The next target for the bulls awaits at Wednesday’s high of $42.68, above which the $43 threshold will get tested.
The hourly Relative Strength Index (RSI) has turned south but remains well within the bullish region, currently at 55.06, allowing for more gains.
However, if the sellers fight back control, the US oil could drop back towards strong support near 41.95/90 region, where the falling trendline resistance now support coincides with the 50-hourly moving average (HMA).
The next critical cap is seen at the 100-HMA at $41.73. WTI has not given an hourly closing below that level since late Tuesday.
A breach of the last could bring the 200-HMA support back in play, which is at $41.55. Meanwhile, the pattern support is located at $41.30.
WTI hourly chart
WTI additional levels

