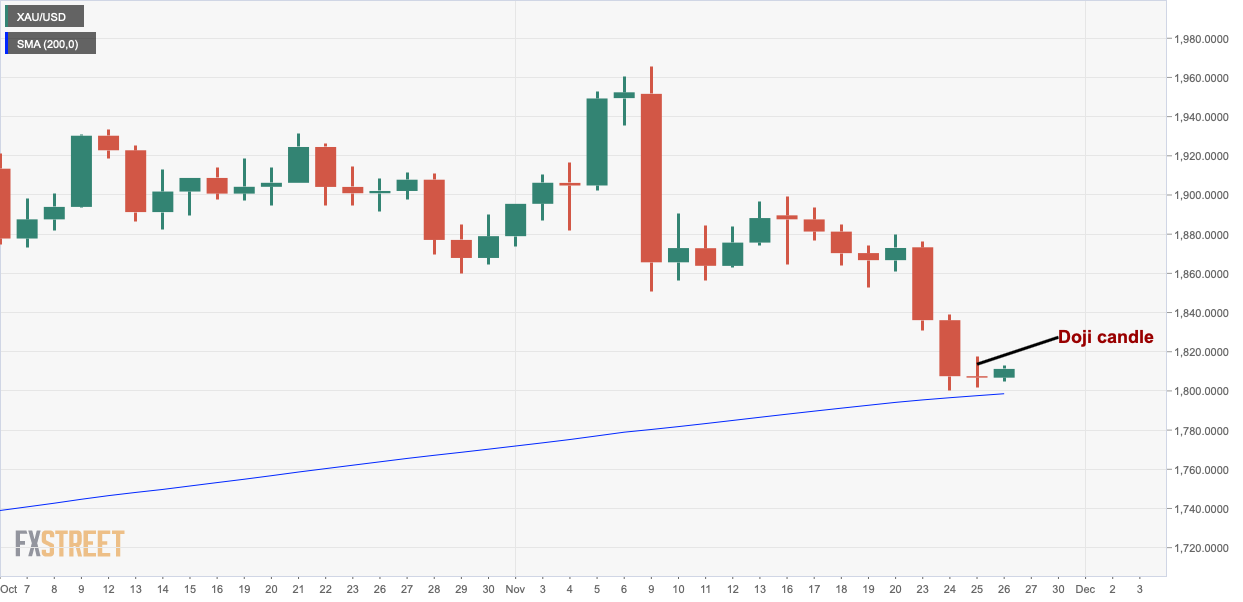
- Gold’s daily chart shows signs of indecision in the market.
- Wednesday’s high and low are levels to beat for bulls and bears, respectively.
Gold is currently hovering near $1,810 per ounce, having formed a Doji candle on Wednesday with a back-and-forth trading in the range of $1,801 to $1,818.
A Doji candle represents indecision in the market and makes the following day’s close pivotal.
In other words, the next move in gold depends on Thursday’s close. Acceptance above the Doji candle’s high of 1,818 would mean the period of indecision has ended with a bull victory and could yield a re-test of the former support-turned-hurdle at $1,880.
Alternatively, a close below $1,801 (Doji’s low) would imply a continuation of the sell-off from the Nov. 9 high of $1,965. That said, the widely-tracked 200-day Simple Moving Average (SMA) is located near $1,798, that is, just below the Doji candle’s low of $1,801.
As such, the 200-day SMA is the level to beat for the bears.
Daily chart
Trend: Neutral
Technical levels
