- Gold fails to extend Friday’s pullback moves, holds 50-day SMA breakout.
- Bullish MACD, risk sentiment favor bulls, descending trend line from August 07 adds to the upside barriers.
Gold remains bid during Monday’s Asian session, heading towards European trading with 0.78% intraday gains to $1,895 currently. In doing so, the yellow metal keeps the last week’s upside break of 50-day SMA while defying pullback moves portrayed on Friday.
Read: S&P 500 Futures wobble around 3,700 as US stimulus news combat Brexit, virus woes
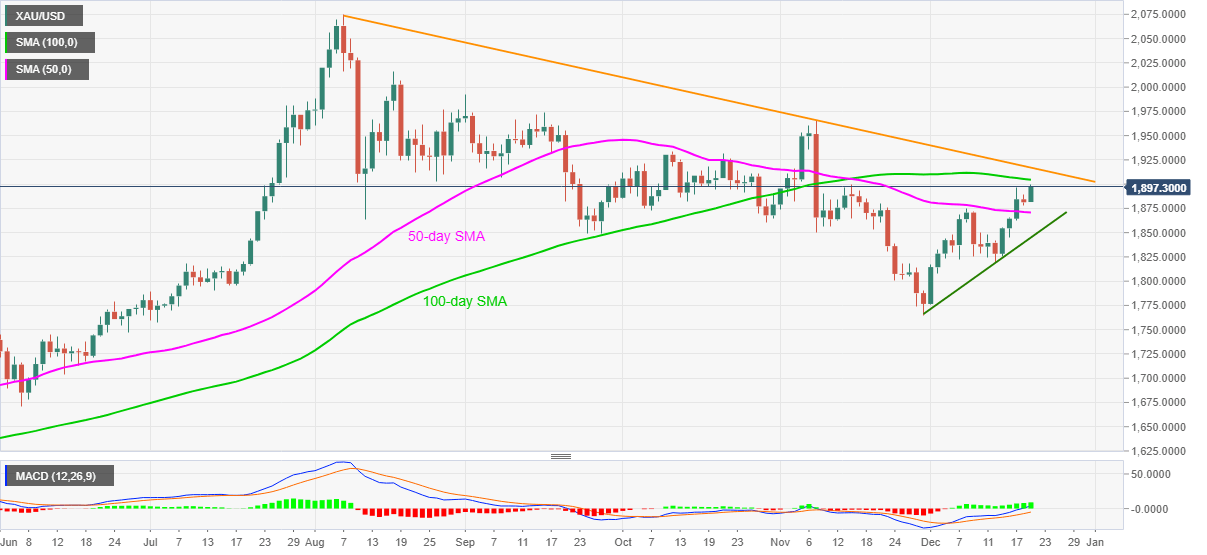
Risk sentiment joins the yellow metal’s ability to stay beyond 50-day SMA to attack the 100-day SMA level of $1,904.55. However, any further upside will eye for a multi-day-old resistance line around $1,917.
Should gold buyers manage to cross $1,917 on a daily closing basis, November’s high near $1,965/66 will be in the spotlight.
Meanwhile, a downside break of 50-day SMA, at $1,870 now, will attack an upward sloping trend line from November 30, currently around $1,844.
If at all the commodity sellers dominate past-$1,844, the monthly low near $1,775 may return to the charts.
Gold daily chart
Trend: Further upside expected
