- AUD/USD stepping up to the plate with sights on a meaningful retracement.
- The longer-term charts offer a downside opportunity for swing traders.
AUD/USD, with 2.44mins to go until the close of the 4-hour candle, is ripening for a short entry to target the weekly 38.25 Fibonacci retracements of the overextended W-formation’s bullish impulse.
The following is a top-down analysis that illustrates where the next opportunity lies within the pair for a 1:3 R/R high probability trade setup.
Monthly chart
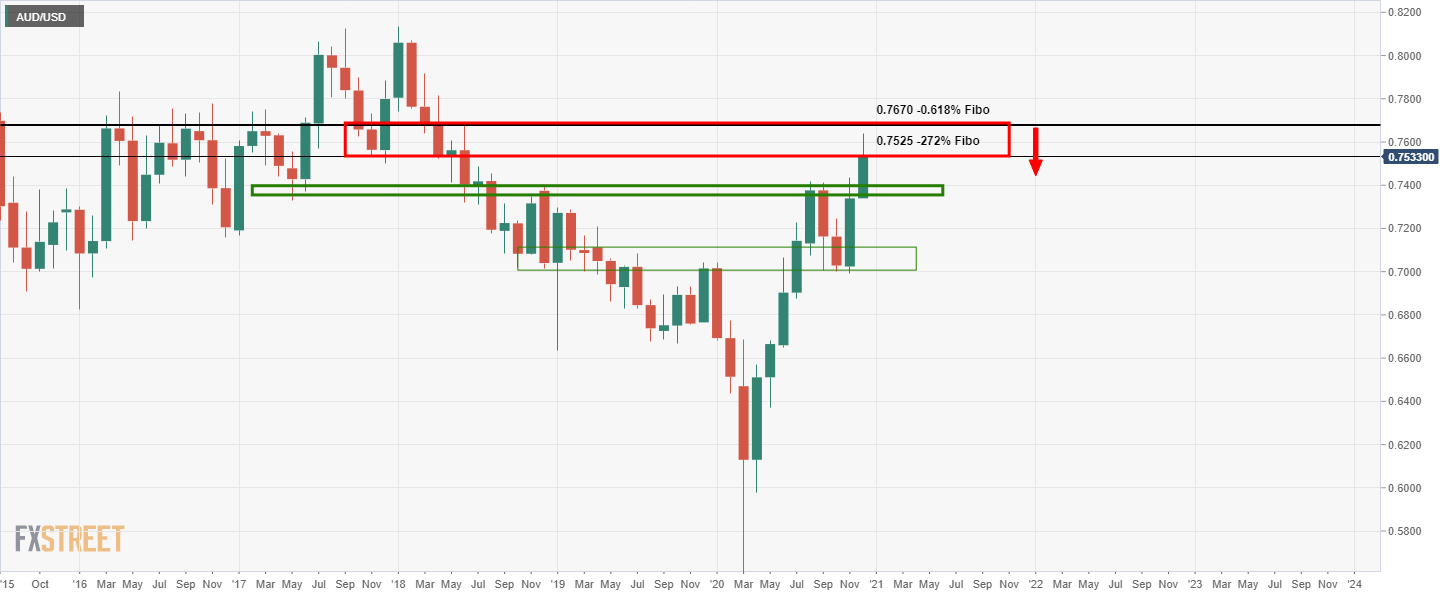
The price is being resisted at old structure on the monthly chart and is failing to extend beyond a -272% Fibonacci retracement of the monthly correction.
Weekly chart
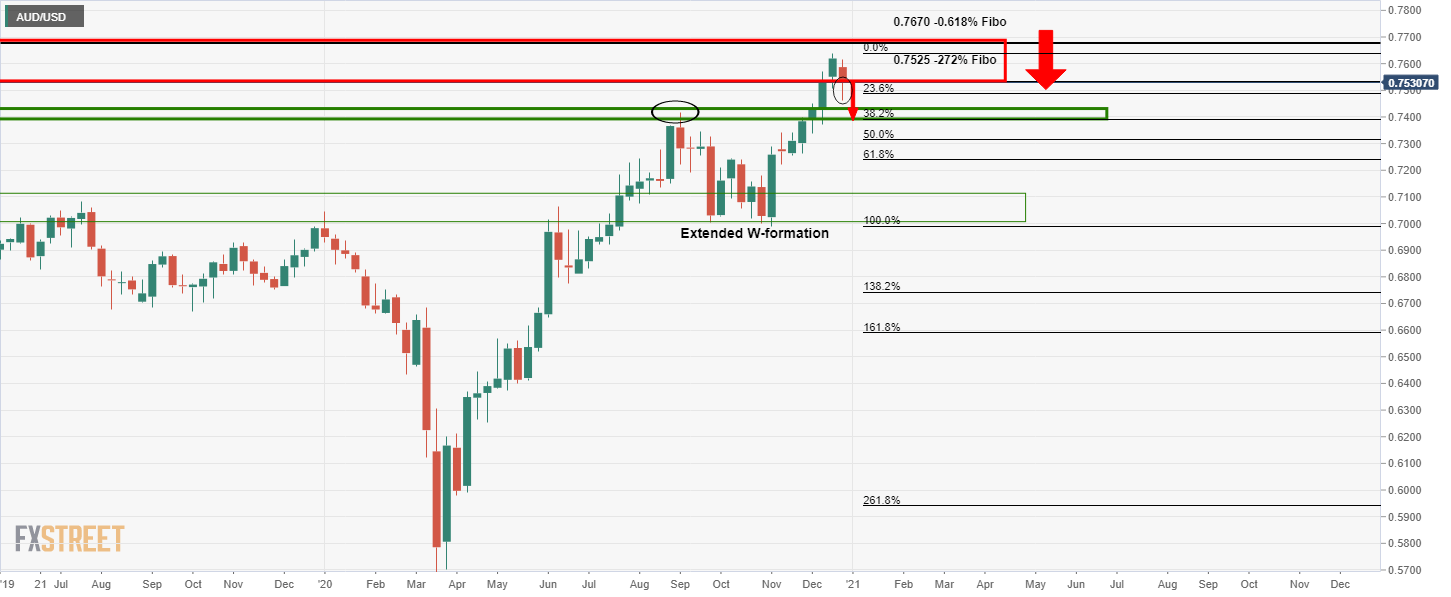
The weekly chart also offers a bearish bias with the W-formation’s correction target to where the 38.2% Fibonacci retracement level meets old structure and resistance looking left.
Daily chart
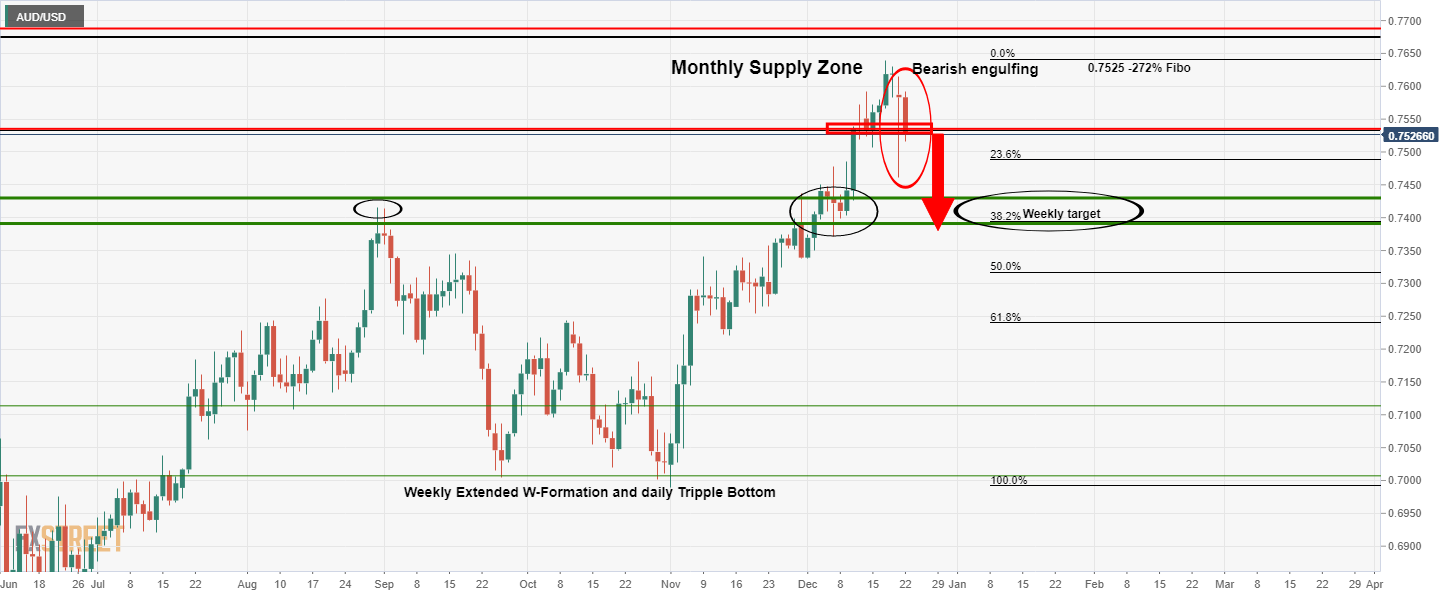
There is a bearish engulfing topping pattern on the daily chart with a wick that is expected to be filled in on the 4-hour time frame.
However, we want to see a close below old support what is now turning resistance. A 40hour close below there would suffice as a trigger so long as the conditions are bearish according to the indicators.
4-hour chart
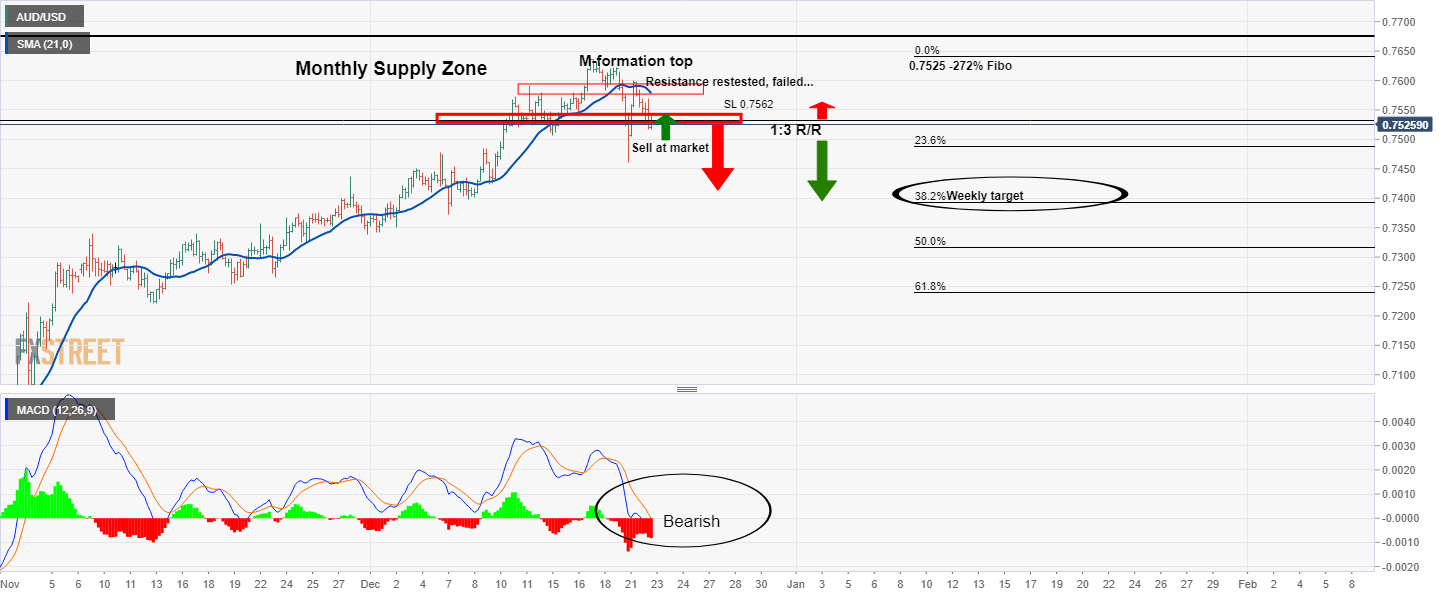
Given the bearish conditions (price below 21 4-hour moving average, MACD below zero), a position can be taken at the market, although, ideally, the 4-hour candle should close below the resistance structure first.
This would offer a layer of confirmation and a sell limit can be left at the structure around 0.7528/30 with just 2hrs.44 mins to go until the close. The risk, however, in waiting for the close is that the price could just run away and not offer a discount back to the structure.
With a stop loss above the prior series of candle’s closes around 0.7570 will offer a 1:3 risk to reward ratio with a target to the 38.2% Fibonacci retracements of the W-formation on the weekly chart.
