- USD/JPY bulls denied yet another stab at the upside.
- 4-hour structure is now critical if the weekly and daily prospects are to playout.
USD/JPY is back into the hands of the bears in a choppy consolidation phase and range between 103.40 and 104.20.
The following is a top-down analysis that illustrates the bullish bias on the longer-term time frame, albeit within a bearish environment on the daily and 4-hour chart.
Weekly chart
-637467850964892040.png)
The weekly chart is bullish according to the W-formation while the neckline support holds the bears at bay.
Daily chart not quite playing out
-637467851669009798.png)
However, the upside playbook is not in favour currently with price now below the structure.
An optimistic scenario
-637467852424069840.png)
However, a break higher, in accordance with the bullish weekly narrative, would draw in demand and likely send the price in a daily bullish extension.
4-hour chart
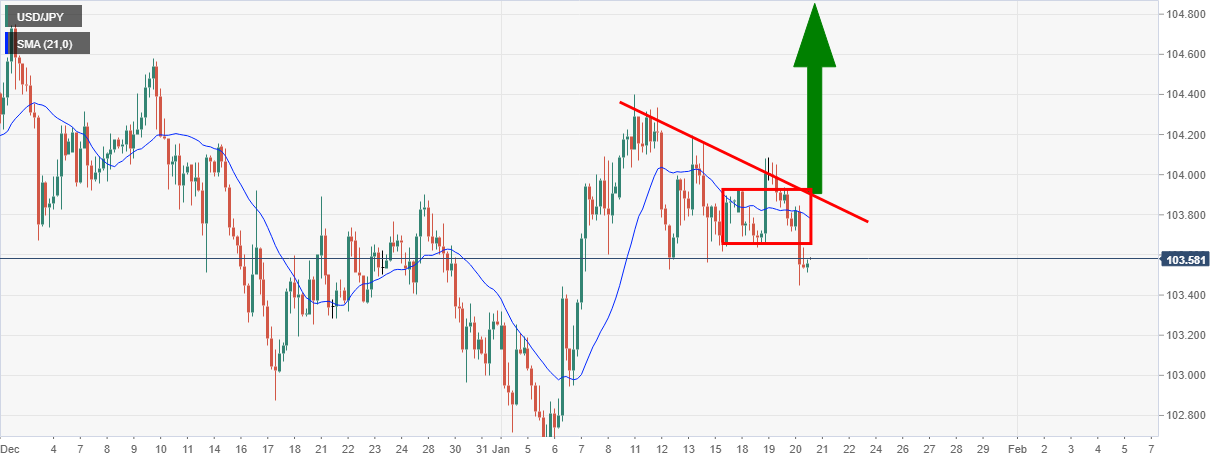
On the 4-hour chart, there is a significant structure to break, including the 20 moving average and the dynamic resistance line.
