- Gold clings to losses as the US dollar remains firmer on the session.
- Mixed technical picture on the 1H chart keeps the sellers hopeful.
- $1865 will offer strong resistance if XAU/USD bounces further.
Gold (XAU/USD) is licking its wounds above $1860, although remains exposed to downside risks amid a broadly stronger US dollar and mixed technical view.
The US dollar remains on the bid, drawing haven demand amid potential risks to US President Joe Biden’s $1.9 trillion stimulus proposal and mounting coronavirus concerns globally.
Although, the bulls could be rescued by the weakness in the US Treasury yields, as markets turn risk-averse ahead of Biden’s speech due later on Friday at 1945 GMT. The US Markit Preliminary PMIs also remains in focus heading into the weekend.
Gold Price Chart: Hourly
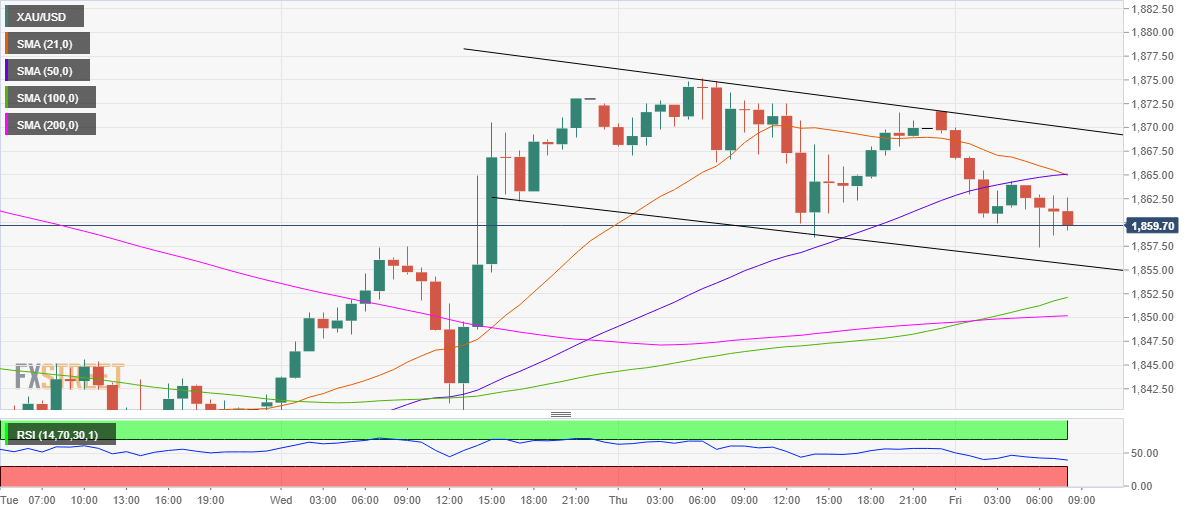
As observed in the hourly chart, gold wavers in a falling channel formation, with the recovery moves likely capped by $1865. That level is the intersection of the 21-hourly moving average (HMA) and 50-HMA.
Also, it’s worth noting that a bearish crossover is formed on the said time frame, as the 21-HMA cuts the 50-HMA from above.
Therefore, the bearish pressures remain intact so long as the price holds below the $1865 hurdle.
Acceptance above that level could bring the two-week highs of $1875 back in play.
To the downside, the channel trendline support at $1856 is likely to be tested, below which the upward-sloping 100-HMA at $1852 will be put at risk.
The Relative Strength Index (RSI) points south while trending below the midline, suggesting that there is more room to the downside.
Gold Additional levels
