- AUD/USD drops to the fresh low of the month after breaking 0.7640 horizontal support.
- Bearish MACD, sustained trading below 21-day EMA suggests further weakness.
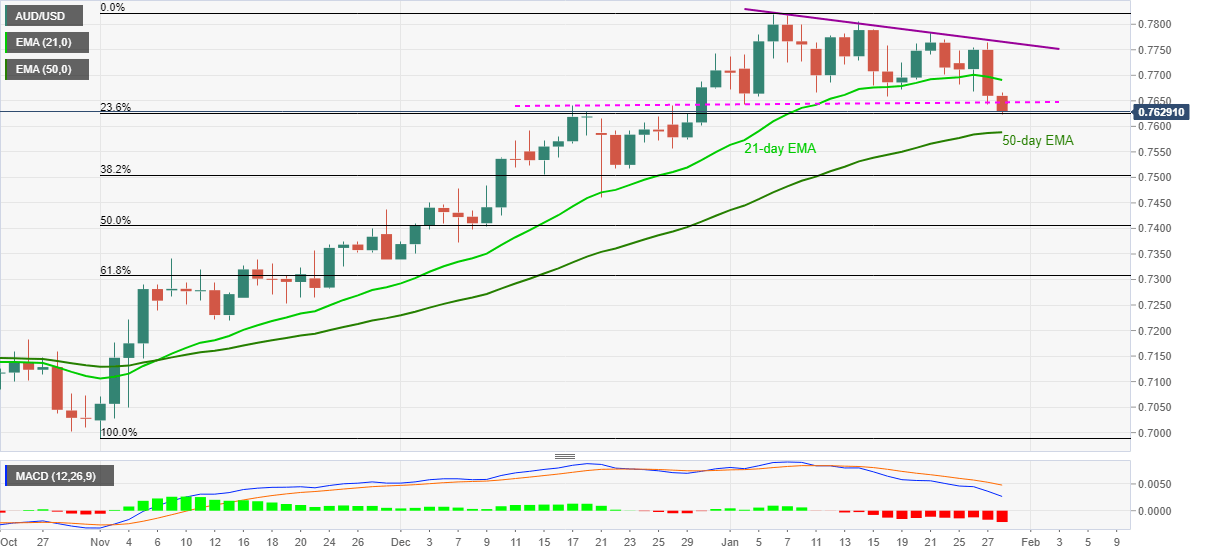
- 50-day EMA lures short-term sellers, monthly resistance line adds to the upside barriers.
AUD/USD takes offers near 0.7628, down 0.42% intraday, after breaking the key support during early Thursday. The quote recently defied a horizontal line comprising December 17 top and January 04 low while extending the previous day’s downside break of 21-day EMA.
Not only the extension of weakness below the key EMA and horizontal support but bearish MACD also favors AUD/USD sellers.
As a result, further declines target 50-day EMA level of 0.7588 with the 0.7600 round-figure acting as immediate support.
In a case where the AUD/USD bears dominate past-0.7588, 38.2% Fibonacci retracement of November 2020 to January 2021 upside, near the 0.7500 round-figure will gain the market’s attention.
On the contrary, the pair’s upside break of 0.7640 needs to clear a 21-day EMA level of 0.7690 to convince the short-term buyers.
Following that, the downward sloping trend line from January 06, currently around 0.7765, can lure the AUD/USD buyers ahead of directing them to the monthly high near 0.7820.
AUD/USD daily chart
Trend: Bearish
