With retail attention back on the whilte metal, Silver (XAG/USD) is trading near the highest levels in six months reached at $29.01 in early Asia. A surge in silver’s demand in physical markets, courtesy of the spillover of the Reddit-driven short squeeze, is the main catalyst behind the ongoing rally in the prices.
Silver has gained nearly 12.50% over the past four trading sessions due to the retail-trade frenzy. The metal looks to retest the 2020 highs at $29.86, as industry experts believe that the physical silver stock is almost over.
How is silver positioned on the technical graphs?
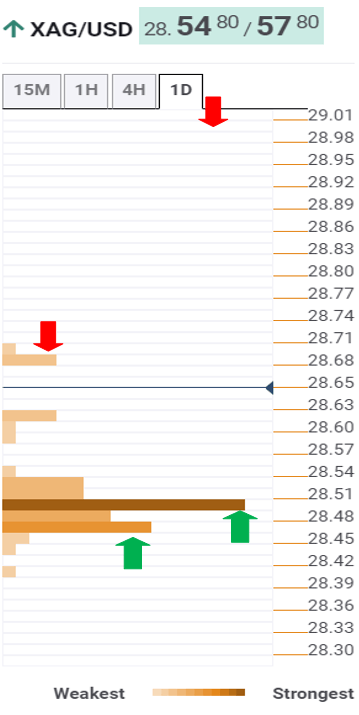
Silver Price Chart: Key resistances and supports
The Technical Confluences Indicator shows that the path of least resistance appears to the north amid a lack of healthy resistance levels.
The XAG bulls are battling the $28.60 hurdle, which the Bollinger Band one-hour Upper, above which six-month highs at $29.01 could be retested.
Buyers would then target seven-year tops at $29.86 en route $30 threshold.
Any pullbacks could meet strong demand around $28.45, which is the convergence of the pivot point one-month R1 and pivot point one-day R2.
The next relevant downside target is seen at the $28 round figure. Further south, the intraday low of $26.98.
Here is how it looks on the tool
About Confluence Detector
The TCI (Technical Confluences Indicator) is a tool to locate and point out those price levels where there is a congestion of indicators, moving averages, Fibonacci levels, Pivot Points, etc. Knowing where these congestion points are located is very useful for the trader, and can be used as a basis for different strategies.
