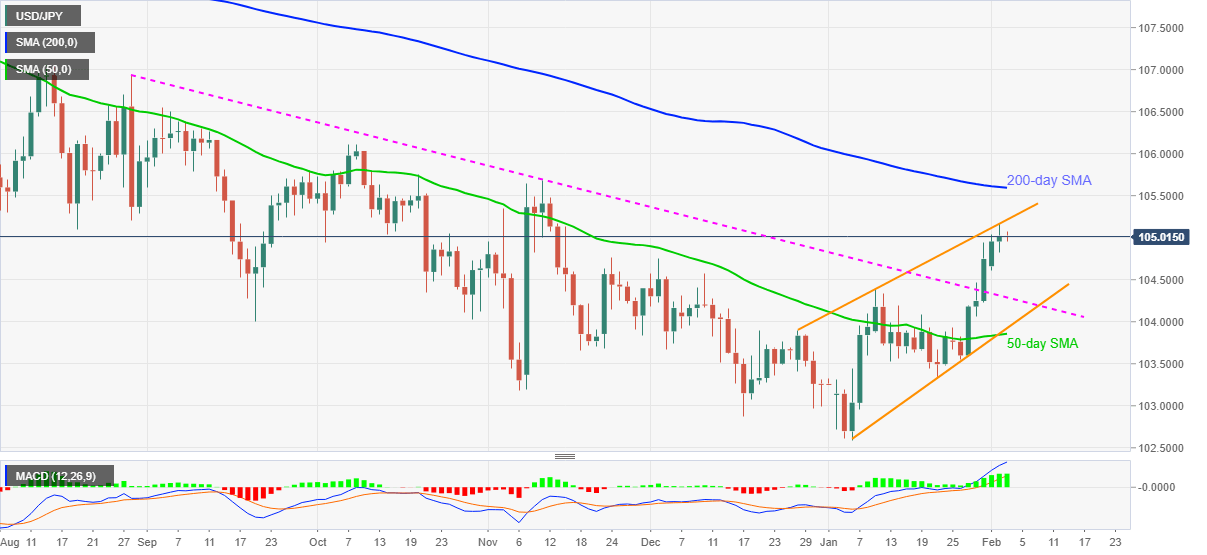
- USD/JPY fizzles upside momentum after five-day winning streak.
- Buyers step back from an ascending trend line from December 28 amid bullish MACD.
- Sustained break of previously important resistance directs traders toward 200-day SMA.
- 50-day SMA, monthly support line add to downside filters.
USD/JPY traders flirt with 105.00 while trying to negate the latest pullback moves during Wednesday’s Asian session. In doing so, the quote battles a short-term resistance line after the recent rally propelled it to the highest since early November.
Considering the bullish MACD and successful break of a falling trend line from August 2020, marked on Friday, USD/JPY is likely to keep the upside momentum.
However, fresh buying targeting the 200-day SMA level of 105.60 will need a clear break of the upward sloping trend line stretched from December 28, at 105.20 now. Also acting as an upside barrier is November’s top near 105.70.
On the flip side, pullback moves may eye the previous resistance line, currently around 104.25, a break of which will recall the 104.00 threshold on the chart.
In a case where USD/JPY bears dominate past-104.00, 50-day SMA and an ascending support line from January 06, around 103.90-85, will be a tough nut to break for sellers.
USD/JPY daily chart
Trend: Bullish
