- EUR/USD’s daily chart shows a bullish breakout above falling trendline.
- The pair appears set to test higher resistance levels.
EUR/USD looks north and could test the 50-day Simple Moving Average (SMA) hurdle of 1.2150, technical charts indicate.
The pair jumped 0.6% to 1.2117 on Tuesday, confirming an upside break of the trendline connecting Jan. 6 and Jan. 29 highs.
Backed by an above-50 reading on the Relative Strength Index and MACD histogram’s impending positive turn, the trendline breakout represents an end of the pullback from the Jan. 6 high of 1.2349 and bull revival.
As such, higher resistance levels could come into play later Wednesday. At press time, the pair is trading largely unchanged on the day near 1.2115.
Daily chart
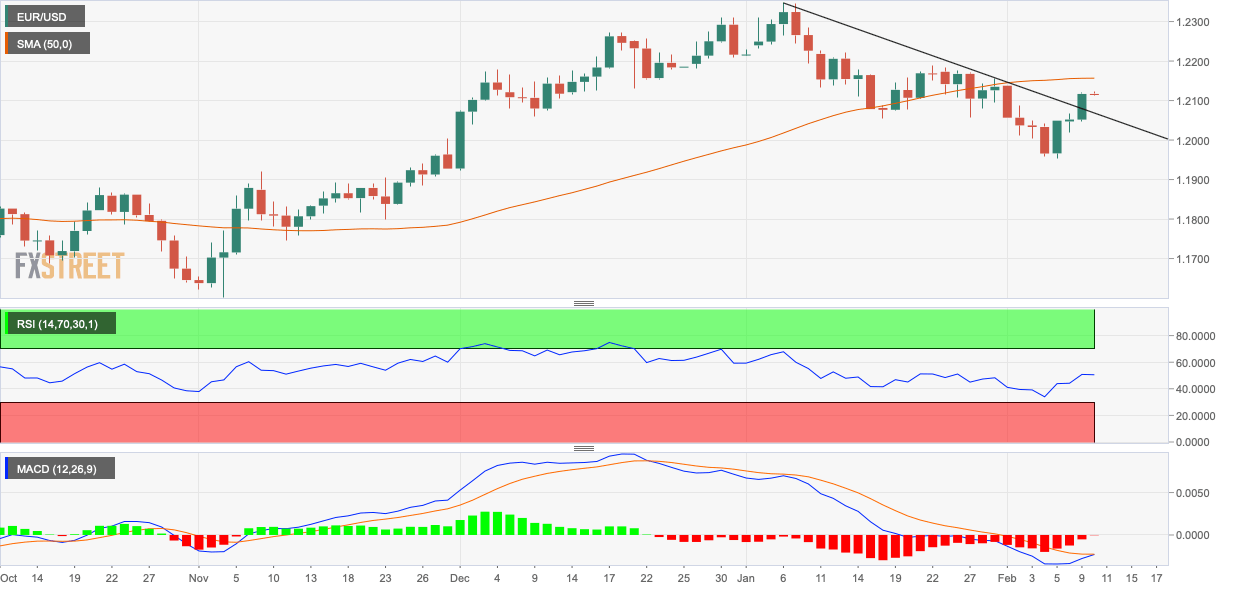
Trend: Bullish
Technical levels
