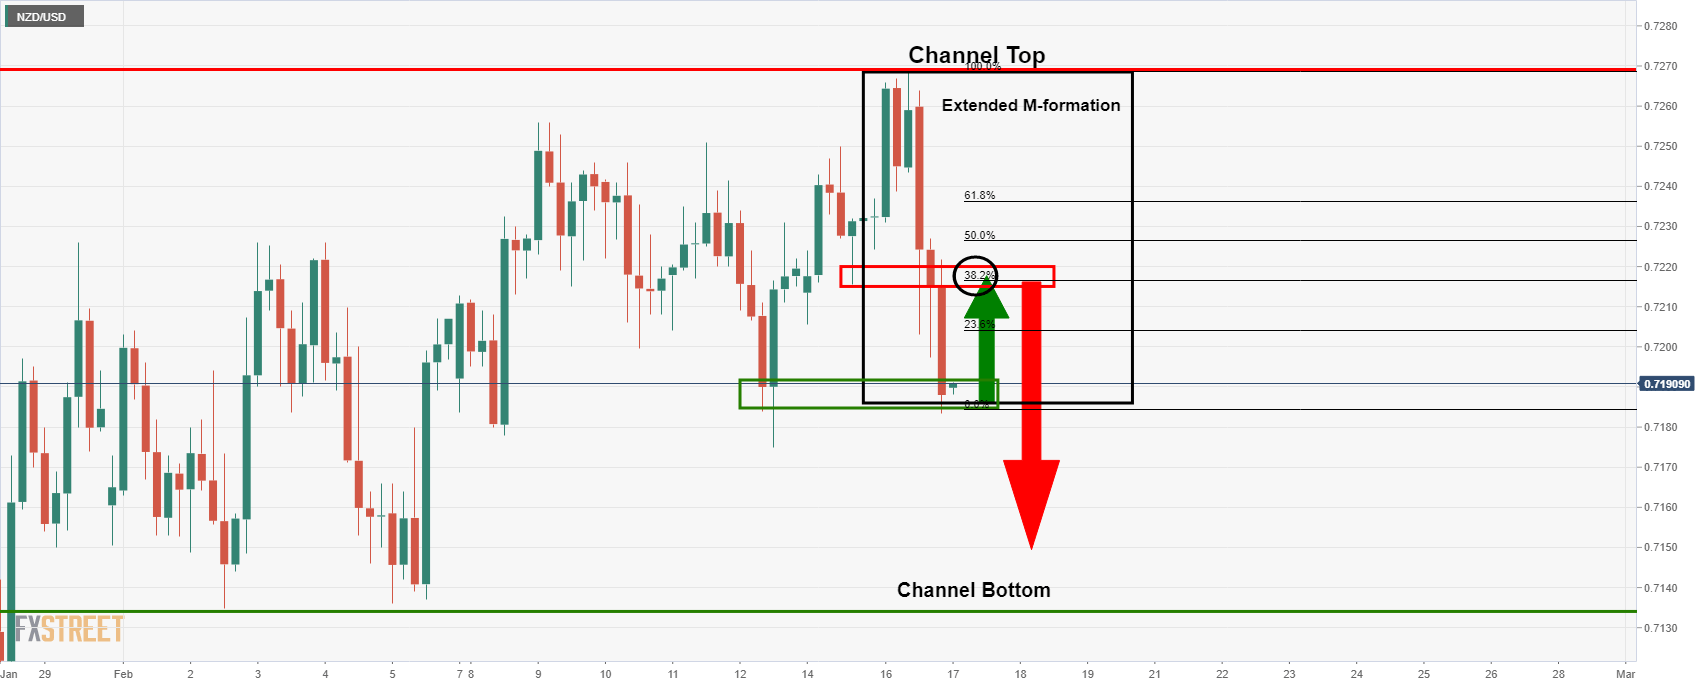
- NZD/USD bears have been in the driver’s seat, forming a daily M-formation.
- There are two scenarios on the cards currently, both of which encompass the M-formation’s allure.
Further to the prior analysis, where the price has been trapped between support and resistance, there are now bullish prospects for an M-formation on the daily chart.
However, the bears are in control, so there is the likelihood of an overextended M-formation as well should the market continue to deteriorate to the support of the channel.
The prior analysis was as follows:
NZD/USD Price Analysis: Trapped between daily support and resistance
NZD/USD bears in control, targetting daily channel support
Prior analysis, 4-hour chart
In Asia, the price dropped to a meanwhile support area where some consolidation and a retest of the 38.2% Fibonacci was expected and subsequently played out.
In doing so, a downside extension can now be expected to challenge the channel support.
Live market, 4-hour
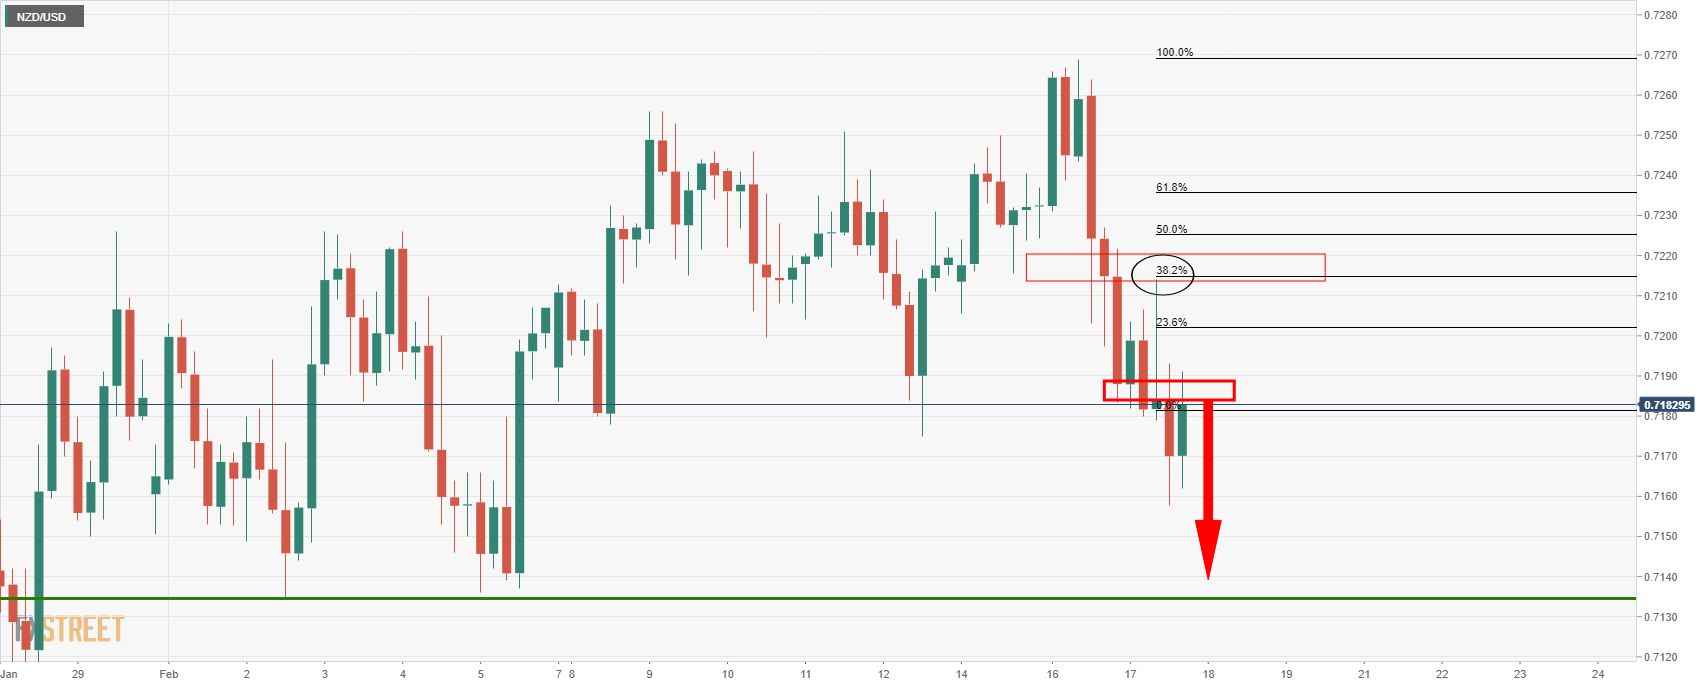
As illustrated, the market tested the 38.2% Fibonacci and then melted back to the downside for a lower low on the way towards channel support.
In doing so, a bullish daily M-formation is being formed as follows:
Daily chart, M-formation
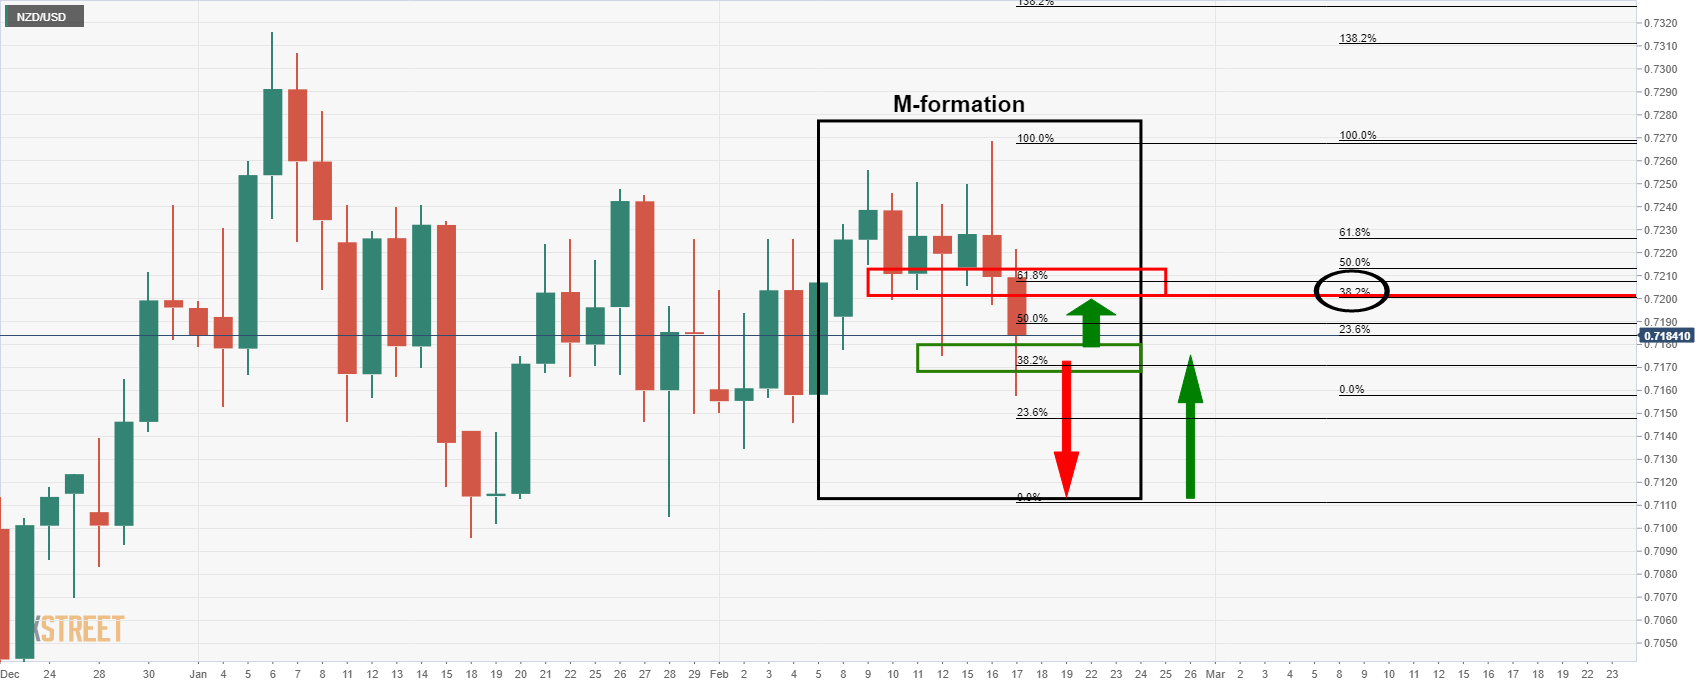
The theory is that an M-formation’s neckline will be tested.
In the current scenario, the neckline already meets a 38.2% Fibonacci retracement level.
However, should the market continue to melt to the channel support, an overextended M-formation will be formed. In such a case, the 38.2% Fibo of the entire bearish impulse a least, or the wick of the formation’s neckline will be targetted.
