Gold trades near $1,782 per ounce at press time, having reached a low of $1,769 – the lowest level since Nov. 30.
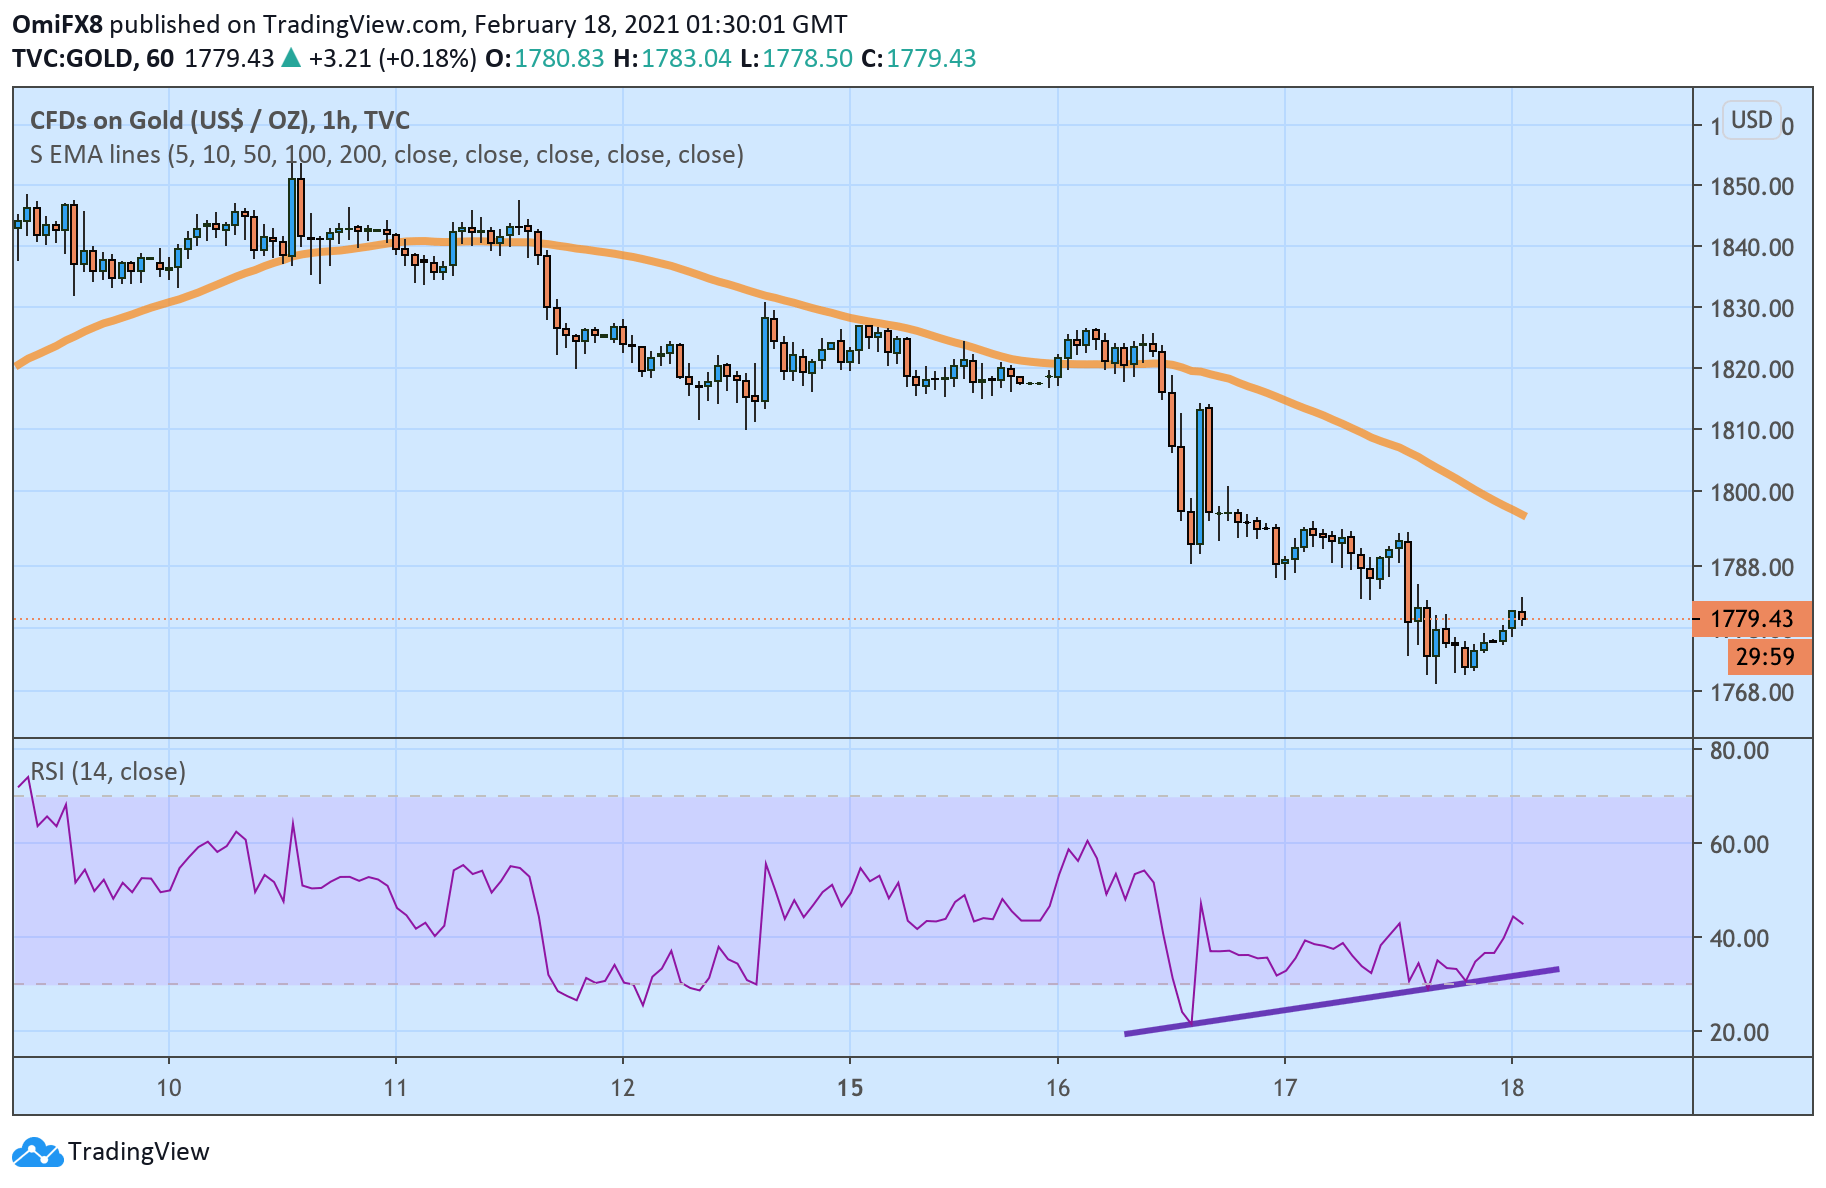
The hourly chart shows a bullish divergence of the Relative Strength Index, which occurs when an indicator forms higher lows, contradicting lower lows on the price chart. The pattern is widely considered a sign of temporary bear fatigue and often yields a corrective bounce.
Therefore, the focus is on the descending 50-hour Simple Moving Average hurdle, currently at $1,796.
A break below the Asian session low of $1,775 would validate Wednesday’s bearish close under $1,785 and open the doors for a slide to $1,764 (Nov. 30 low).
Hourly chart
Trend: Corrective bounce
Technical levels
