- NZD/USD eases after rising to the fresh high since April 2018.
- Bulls cheered break of January’s top, sustained trading above 50-day SMA.
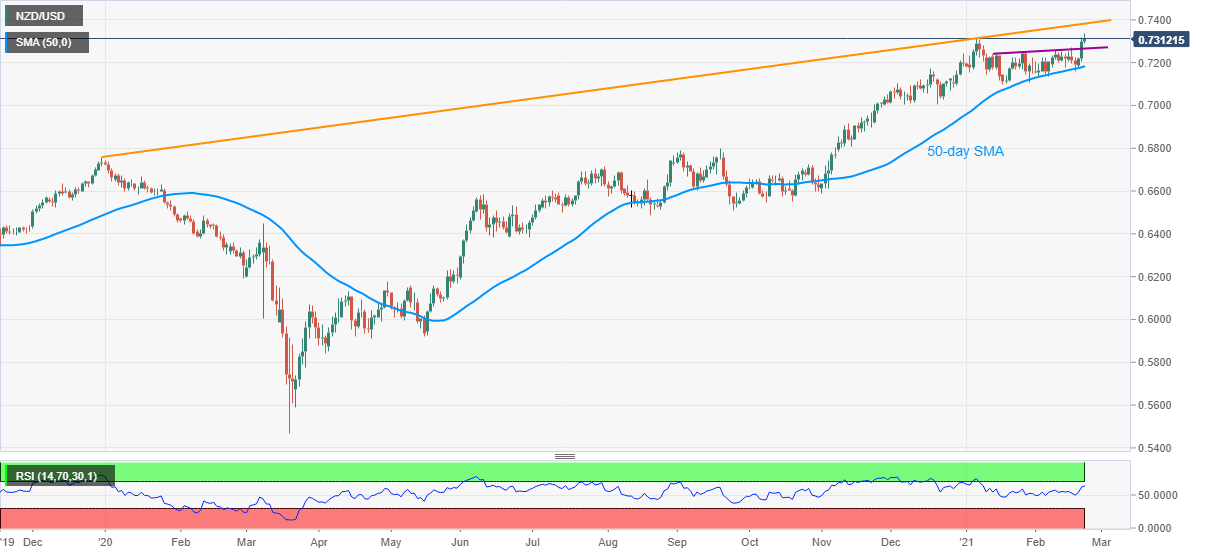
- Further upside targets an ascending trend line from December 2019.
NZD/USD slips below January’s top while trimming the early Asia gains to 0.21% intraday, currently around 0.7313, ahead of Monday’s European session.
Before a few hours, the kiwi pair rose to a fresh high since April 2018 after crossing January’s top of 0.7316 with a 0.7338 level. The following consolidation, though, defies the breakout while eyeing to revisit the six-week-old resistance line, now support, around 0.7265.
Though, any further weakness past-0.7265 will need to conquer the 50-day SMA level of 0.7183 to recall the NZD/USD sellers.
Meanwhile, successful trading beyond 0.7316 directs the bulls towards the multi-day-old resistance line, currently around 0.7385.
It should, however, be noted that the NZD/USD rise past-0.7385 will be challenged by the 0.7400 threshold as well as February 2018 peak near 0.7440.
NZD/USD daily chart
Trend: Bullish
