- Gold probes key falling trendline hurdle on the hourly chart.
- Treasury yields hold the advance, making it an uphill task for bulls.
- RSI turns south but holds above 50.00, keeping buyers hopeful.
Gold (XAU/USD) is struggling to extend its recovery from seven-month lows in early Europe, as the two-week-old falling trendline resistance at $1795 on the hourly chart tests the bulls’ commitment.
However, the bull cross, with the 21-hourly moving average (HMA) having crossed the 50-HMA from below, favors the further upside.
Gold Price Chart: Hourly chart
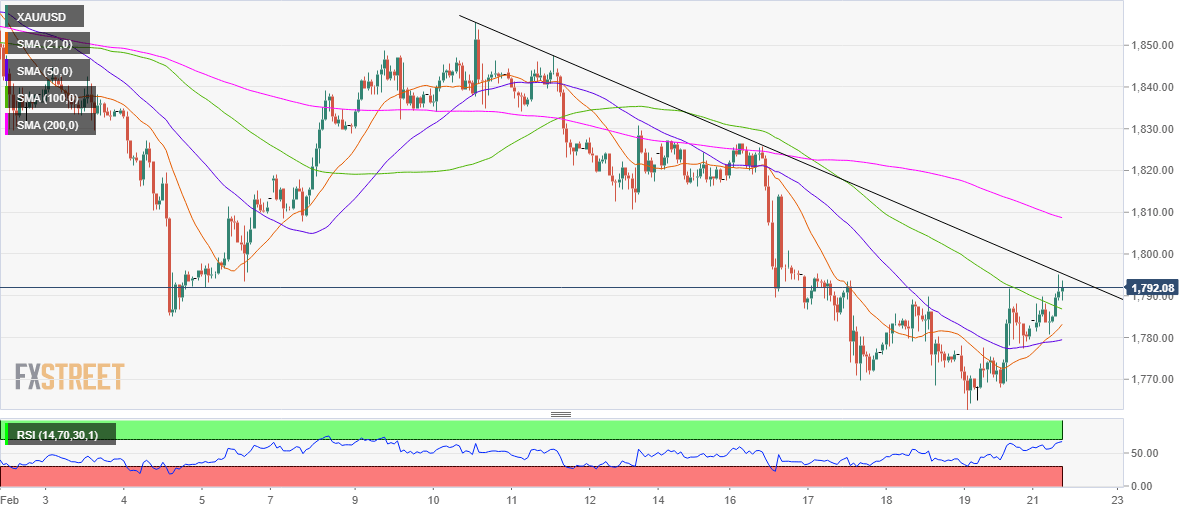
Gold has recaptured the bearish 100-HMA at $1787 and holds well above the latter, adding credence to more gains in the offing.
Acceptance above the aforesaid critical resistance could fuel a sharp rise towards the downward-sloping 200-HMA at $1809. Ahead of that, the January low of $1803 could be challenged.
Alternatively, the 100-HMA could now offer immediate support, below which the 21-HMA at $1783 could come to the buyers ‘rescue.
Further down, the horizontal 50-HMA at $1779 would come into the picture.
Gold: Additional levels
