- AUD/USD is offering a number of potential scenarios.
- A varied number of chart patterns could play out in the following analysis.
The following is an extensive analysis of the AUD/USD charts that covers the monthly down to the 4-hour to help traders analysis the possible outlook for the pair and assist with their trading setups.
There is quite a varied picture that requires patience for the possibilities to play out.
Weekly chart

Firstly, the weekly chart is compelling. A Topping formation could be in the making here.
A Head & Shoulders formation could be forming with the latest bullish impulse a correction of the prior bearish impulse and reaching a 50% mean reversion. The recent highs could cap the correction and in doing so, the price action will result in a right-hand shoulder of the bearish pattern.
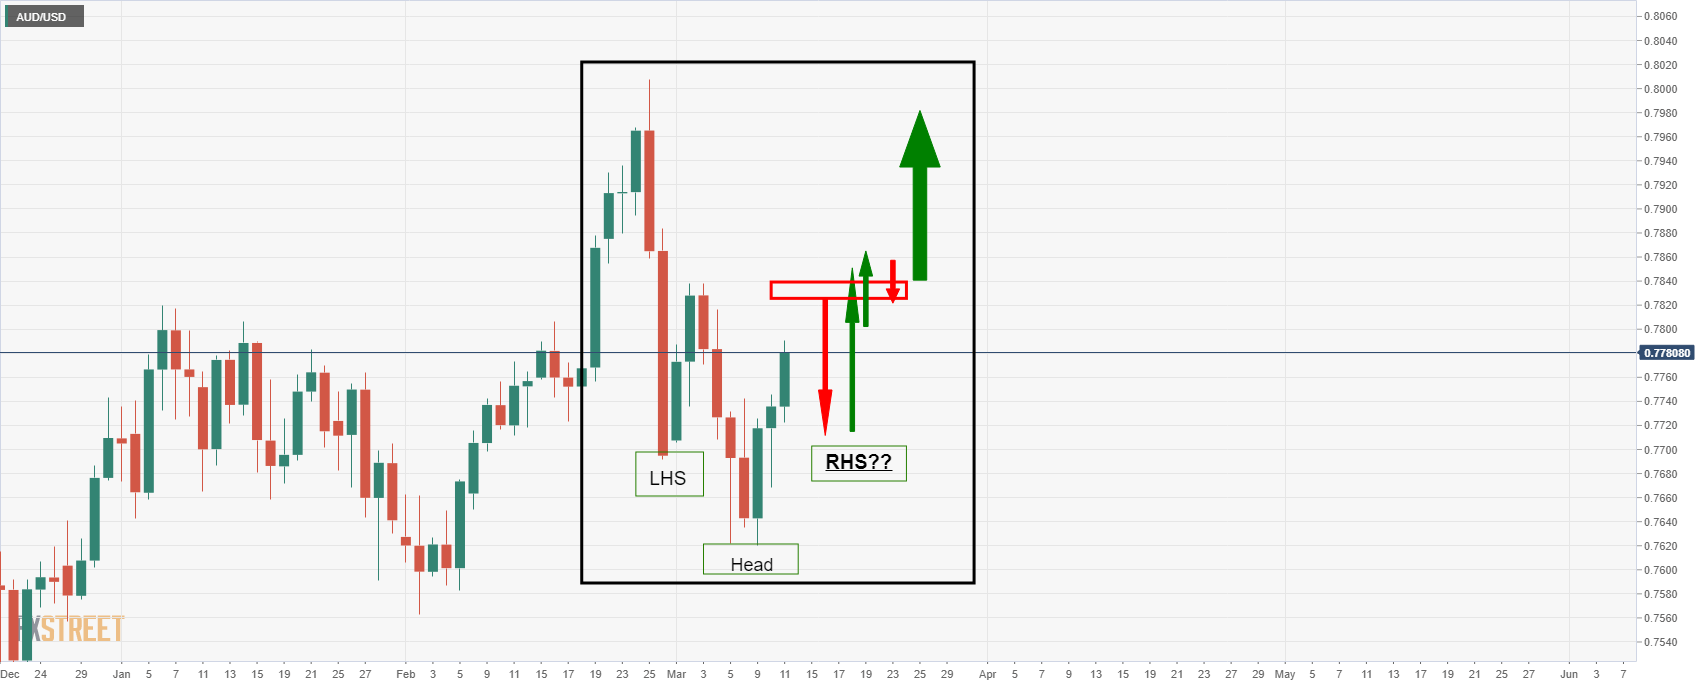
Daily charts
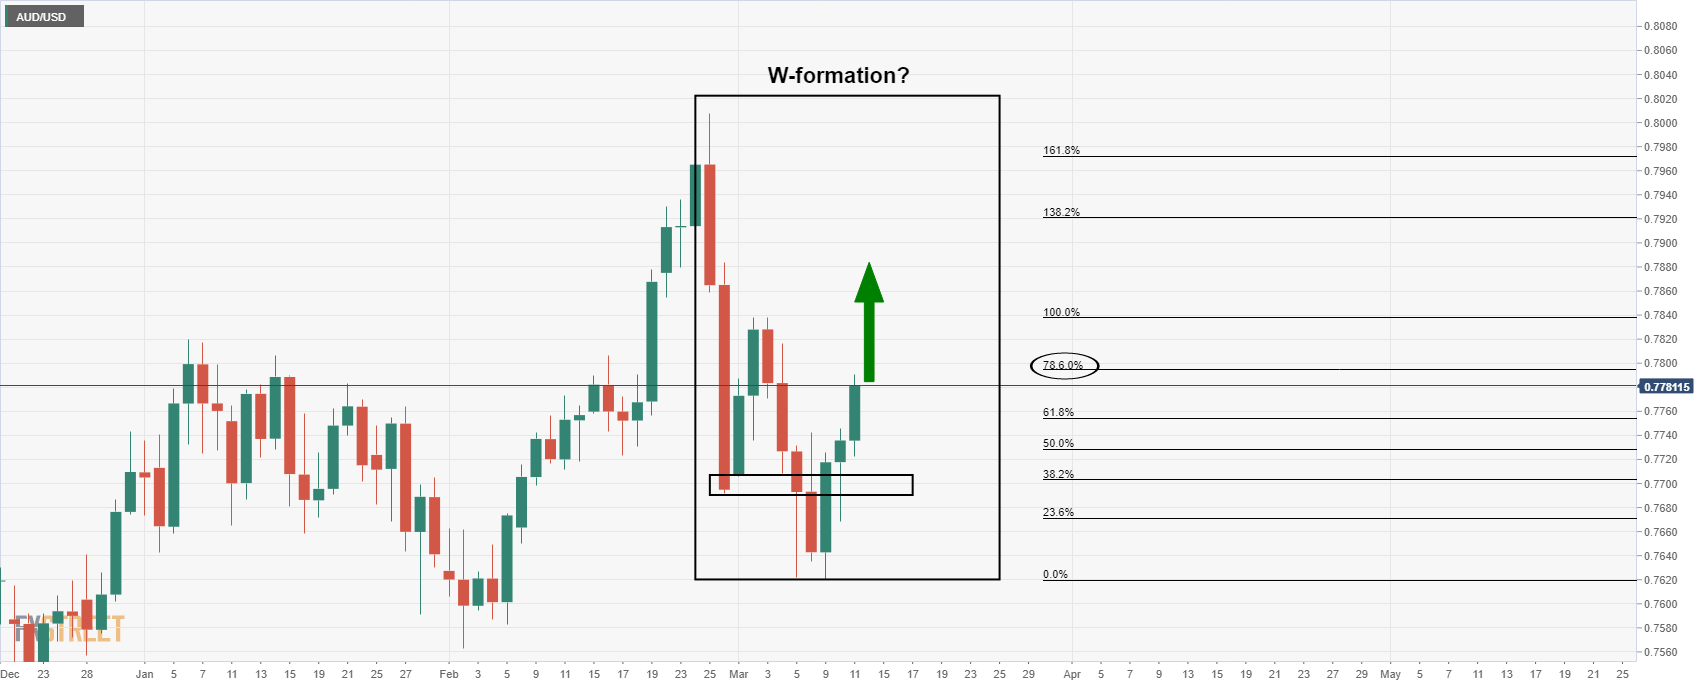
The daily charts are offering the prospects of either a W-formation if the price breaks the 78.6% or a more complicated scenario in the formation of a bullish Reverse Head & Shoulders:
4-hour chart
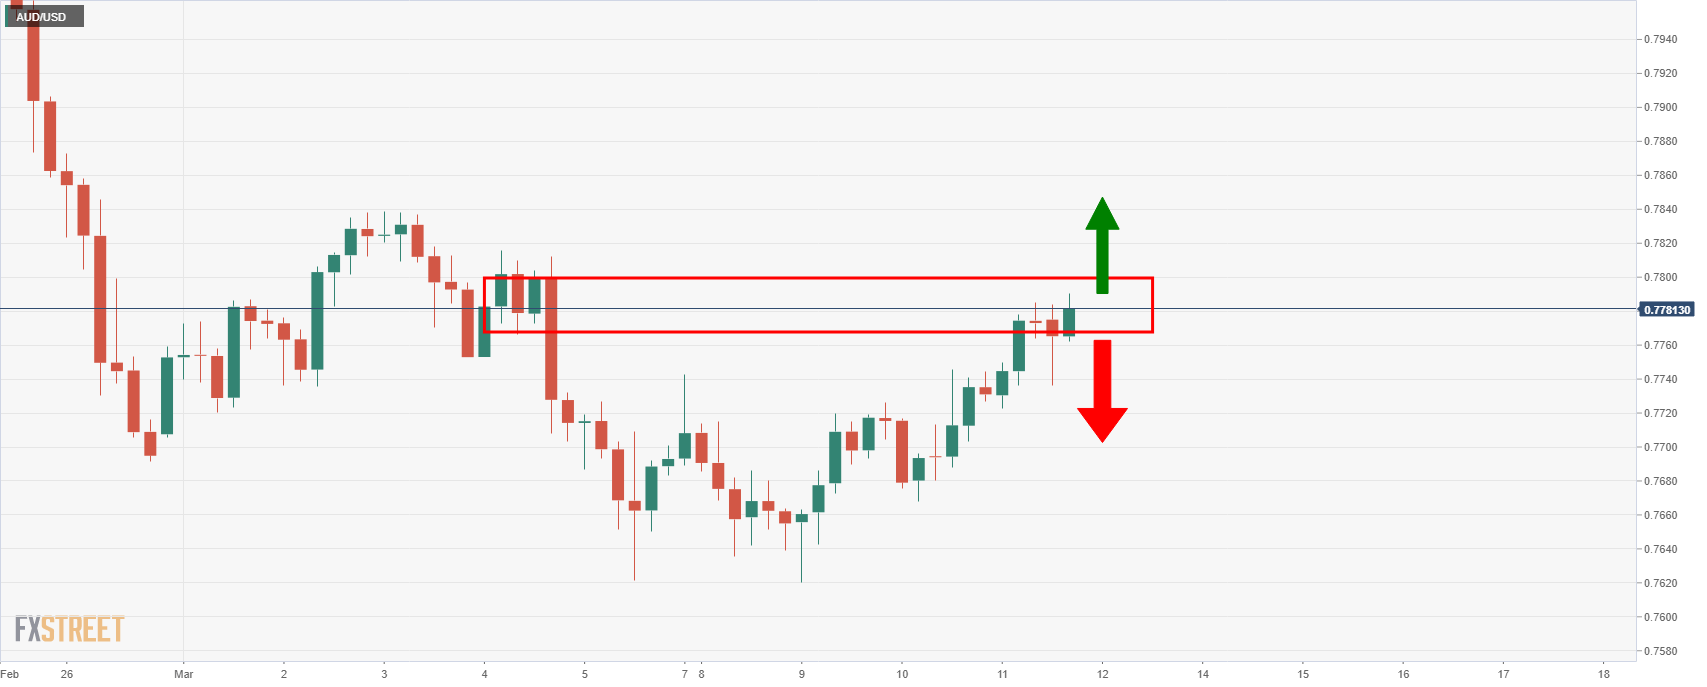
At this juncture, the 4-hour chart shows that the price is testing resistance.
Monthly chart
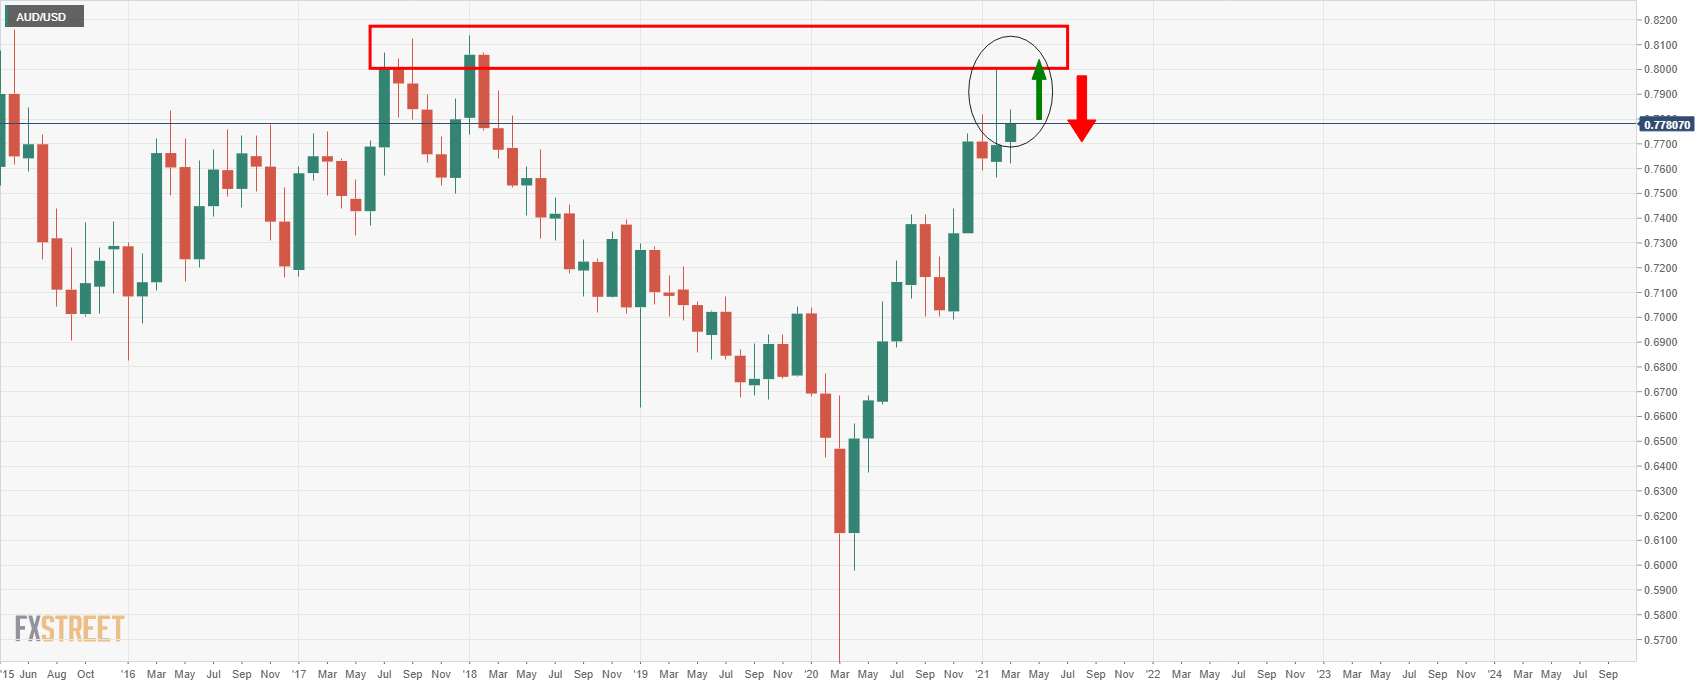
Meanwhile, in noteworthy observation, the bulls are currently seeking to fill in the monthly wick in a deeper test of the supply zone.
This would see the daily scenarios fulfilled but invalidate the weekly bearish Head & Shoulders.
