Gold is currently trading near $1,717 per ounce, representing a 0.25% drop on the day.
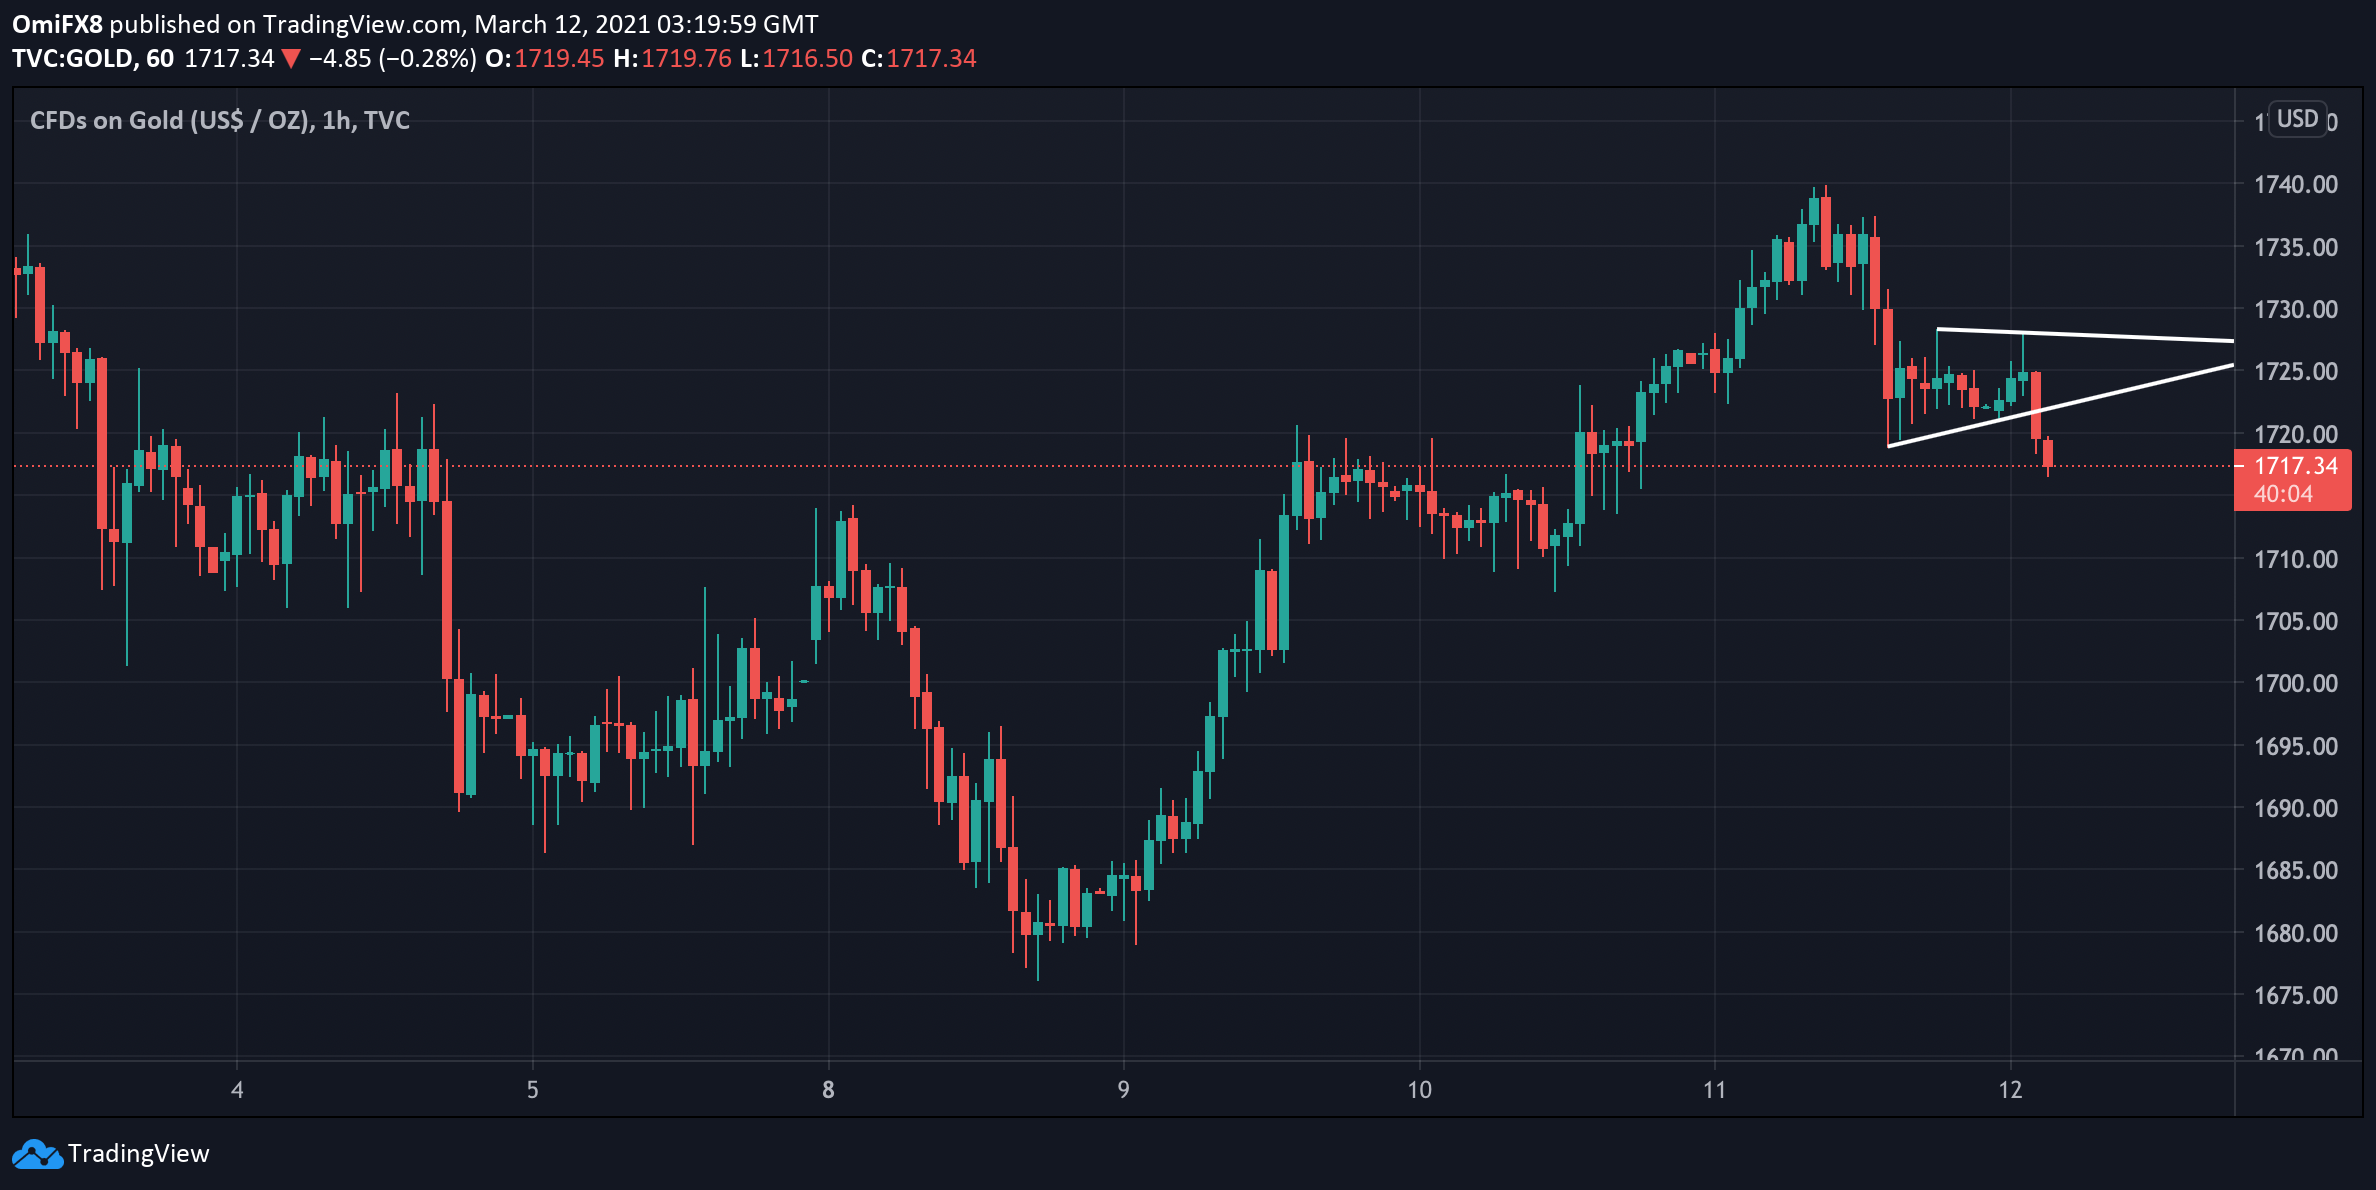
The 15-minute chart shows the metal has dived out of a narrowing price range, or triangle pattern, opening the doors for an extension of the pullback from Thursday’s high of $1,740.
That, alongside the bearish view put forward by the long upper wick attached to Thursday’s candle, suggests scope for a re-test of the recent low of $1,676.
A close above Thursday’s high of $1,740 is needed to invalidate the selling pressure.
Hourly chart
View: Bearish
Technical levels
