- AUD/USD is prepped up for a fresh leg higher towards 0.7900.
- Inverse H&S breakout confirmed on the 4H chart for the aussie.
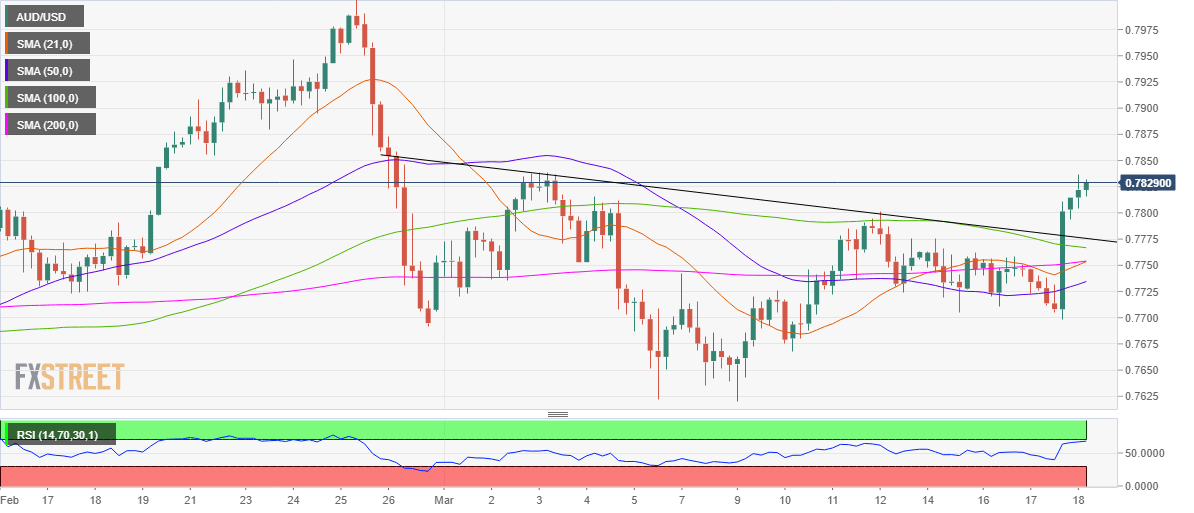
- RSI points north towards the overbought region, backing the upside case.
AUD/USD challenges two-week highs above 0.7800, looking to extend the Federal Reserve (Fed) decision-backed rally towards the 0.7900 mark.
The aussie witnessed a big figure surge after the Fed reaffirmed its dovish stance on the monetary policy, pushing back the rate hike expectations well into 2023. The Fed’s dovishness weighed heavily on the US dollar, which lifted AUD/USD well beyond the 0.7800 threshold.
The additional upside in the spot could be attributed to the strong Australian employment report released earlier in the Asian session. The data showed that the jobless rate dropped to 5.8% last month. Markets predicted the unemployment rate to hold steady at 6.3% in the report month.
Next of relevance for the major remains the US weekly jobless claims data, although the dynamics in the Treasury yields and the greenback will continue to play a pivotal role.
AUD/USD: Technical Outlook
As observed on the four-hourly chart, the aussie has confirmed an inverse head-and-shoulders (H&S) formation, which is a bullish reversal pattern.
The dovish Fed verdict prompted the spot to break through the pattern neckline, then at 0.7780, on a candlestick closing basis.
Therefore, the bulls remain poised for a fresh rally towards the 0.7900 mark, with a test of the measured pattern target at 0.7980 due on the cards in the near-term.
The relative strength index (RSI) looks northwards while probing the overbought territory, suggesting that there is additional room to the upside.
Adding credence to a potential move higher, the aussie confirms a bull cross, as the 21-simple moving average (SMA) rises above the horizontal 200-SMA.
It’s also worth noting that the price trades above all the major averages on the given timeframe.
Any retracement could see initial support at 0.7776, the pattern neckline resistance now support.
A breach of the last would expose the downward-sloping 100-SMA at 0.7766. The last line of defense for the AUD bulls is seen at 0.7754, the confluence of the 21 and 200-SMAs.
AUD/USD: Four-hour chart
AUD/USD: Additional levels
