- Silver attracted some dip-buying near the $24.60 region on the first day of a new week.
- Mixed oscillators on hourly/daily charts warrant caution before placing fresh bullish bets.
- A sustained move beyond $25.55-60 region is needed to confirm a near-term positive bias.
Silver has managed to recover its intraday losses to the $24.60 region and has now moved to the top end of its daily trading range. Bulls now await a sustained move beyond the key $25.00 psychological mark before positioning for an extension of last week’s rebound from YTD lows, around the $23.80-75 region.
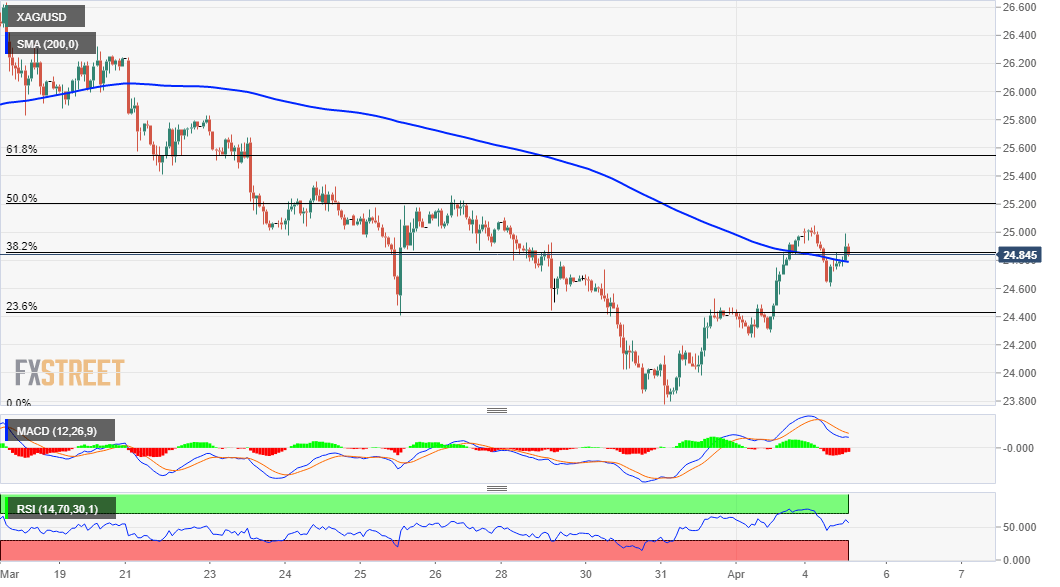
The white metal was last seen trading just above a confluence region comprising of 200-hour SMA and the 38.2% Fibonacci level of the $26.64-$23.78 recent decline. This is followed by the $25.25-30 supply zone, which coincides with the 50% Fibo. level and should now act as a key pivotal point for short-term traders.
A sustained move beyond will set the stage for additional gains and push the XAG/USD further towards the 61.8% Fibo. level resistance near the $25.55-60 region. Some follow-through buying will be seen as a fresh trigger for bullish traders and pave the way for a move back towards reclaiming the $26.00 round-figure mark.
Meanwhile, technical indicators on hourly charts have been gaining positive traction and add credence to the constructive outlook. That said, oscillators on the daily chart – though have recovered from the negative zone – are yet to confirm a bullish bias and warrant some caution before positioning for any further gains.
Hence it will be prudent to wait for some strong follow-through buying beyond the $25.25-30 resistance before confirming that the XAG/USD has bottomed out in the near term.
On the flip side, the daily swing lows, around the $24.60 region now seems to protect the immediate downside ahead of the 23.6% Fibo. level, around the $24.40 area. Failure to defend the mentioned support levels will negate any near-term positive bias and prompt some aggressive selling around the XAG/USD.
The commodity might then turn vulnerable to slide back below the $24.00 mark and retest multi-month lows, around the $23.80-75 region. The downward trajectory could further get extended towards the $23.25, $23.00 intermediate support levels before the XAG/USD drops to December 2020 swing lows, around the $22.60-55 zone.
XAU/USD 1-hour chart
Technical levels to watch
