US ten-year yields have been rising from their lows – and that is an adverse development for gold. The price of the precious metal has been descending from the highs as returns on Treasuries respond to a sharp increase in producer prices, which may eventually turn into consumer inflation.
In the meantime, how is XAU/USD positioned on the charts?
The Technical Confluences Detector is showing that gold faces substantial resistance at $1,749. This line is the convergence of the Fibonacci 38.2% one-day, the Pivot Point one-week Resistance 1, and the previous 4h-low.
The next cap is at $1,760, which is the meeting point of the Bollinger Band one-day Upper and the previous monthly high.
Looking down, weak support awaits at $1,739, which is the confluence of the Simple Moving Average 10-15m, the PP one-day S1, and the BB 1h-Lower.
A more significant cushion is at $1,733, which is a juncture including the previous daily low and the previous weekly high.
XAU/USD resistance and support levels
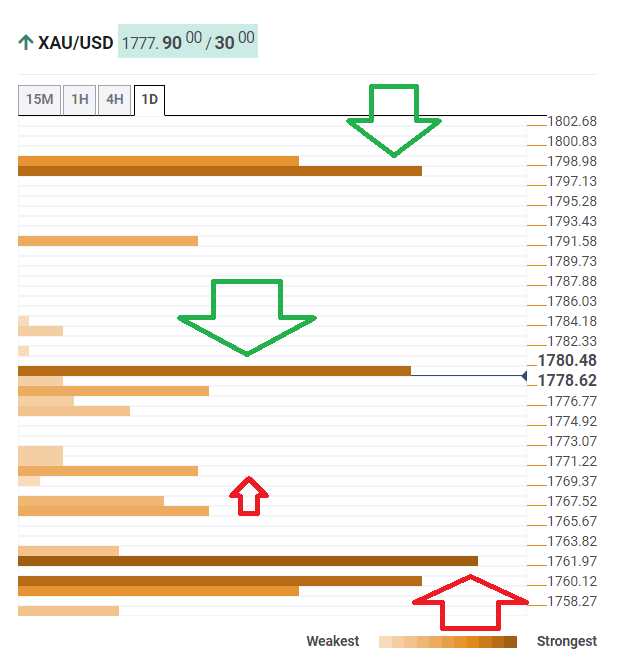
Confluence Detector
The Confluence Detector finds exciting opportunities using Technical Confluences. The TC is a tool to locate and point out those price levels where there is a congestion of indicators, moving averages, Fibonacci levels, Pivot Points, etc. Knowing where these congestion points are located is very useful for the trader, and can be used as a basis for different strategies.
Learn more about Technical Confluence
