- NZD/USD hovers near the 0.7030 level, lacking directional strength.
- The descending trend line offers resistance confluence for the pair.
- Negative MACD favors a bearish outlook.
The NZD/USD pair refreshes the daily lows near the 0.7010 level in the European session. Moving in a narrow trade band around 0.7020-30, the prices lack any immediate follow-through action.
At the time of writing, NZD/USD is trading at 0.7027, down 0.01% on the day.
NZD/USD hourly chart
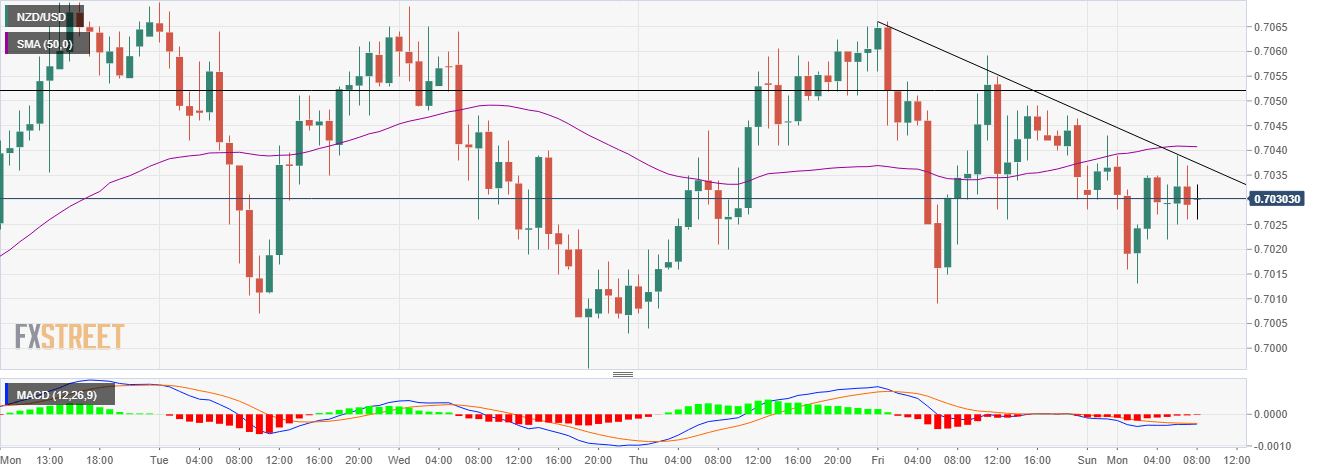
On the hourly chart, NZD/USD has been consolidating near 0.7030 a key psychological level. The price faces rejection near the downside trend line, which is extending from Friday’s high near the 0.7070 region. The formation of a Doji candle indicates a state of indecision among investors as of now.
The Moving Average Convergence Divergence (MACD) oscillator trades below the midline with a negative bias. A sustained downside below 0.7030 would ask for weekly lows near 0.7000 and the next would be the lows of April 1st near the 0.7045 region.
On the flip side, a break above the descending trend line will meet the 0.7045 horizontal resistance zone. Further, bulls will keep their eyes on Friday’s high near 0.7070, making it easier for them to climb toward the top of March 23 near the 0.7170 area.
NZD/USD additional levels
