- DXY eases from intraday low but snaps two-day downtrend.
- 61.8% Fibonacci retracement level guards immediate upside, previous month’s low restricts short-term declines.
US dollar index (DXY) steps back from intraday top to 90.92 while heading into Tuesday’s European session. In doing so, the US dollar gauge trims early Asian gains, the first since Wednesday.
While the latest pullback suggests the quote’s decline to last Tuesday’s low near 90.85, any further downside will be challenged by a horizontal area comprising lows marked since early March, around 90.65.
It should, however, be noted that the DXY weakness past-90.65 will make it vulnerable to revisit break the 90.00 threshold on the way to late February lows near 89.70.
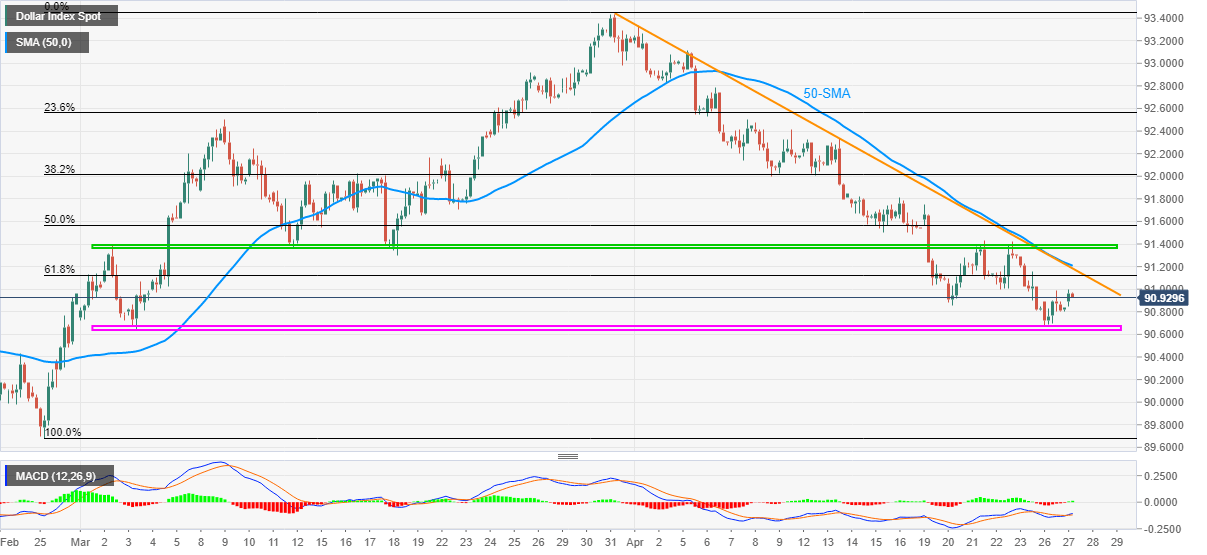
On the contrary, 61.8% Fibonacci retracement level of late-February to March-end upside, near 91.10, offers nearby resistance to watch ahead of the key 91.20 confluence comprising 50-SMA and a falling trend line from March 31.
If at all the greenback buyers manage to cross 91.20, a two-month-old horizontal area around 91.40 will be in the spotlight.
DXY four-hour chart
Trend: Bearish
