- XPD/USD struggles to keep the previous day’s recovery moves.
- Bullish MACD, sustained trading beyond the key SMA keeps buyers hopeful.
- 61.8% FE adds to the upside filters, three-week-old horizontal area offers extra support.
Palladium (XPD/USD) picks up bids from intraday low while flashing $2,965.77 as a quote ahead of Tuesday’s European session. In doing so, the bullion justifies its pullback moves from a short-term resistance line and sustained trading beyond important supports.
Given the MACD flashing bullish signals, Palladium is up for another battle with a downward sloping trend line from May 04, near $2,991.
However, the quote’s further upside will be tested by the $3,000 threshold and then by the monthly peak, also the record top, near $3,020.
In a case where Palladium rallied beyond $3,020, 61.8% Fibonacci retracement of its April-May upside, followed by Friday’s pullback, around $3,080 will gain the market’s attention.
Meanwhile, a confluence of 100-SMA and 23.6% Fibonacci retracement level near $2,910 could limit the commodity’s short-term downside.
Also challenging the Palladium sellers is a horizontal area comprising multiple highs marked since April 21, around $2,900 round-figure.
Palladium four-hour chart
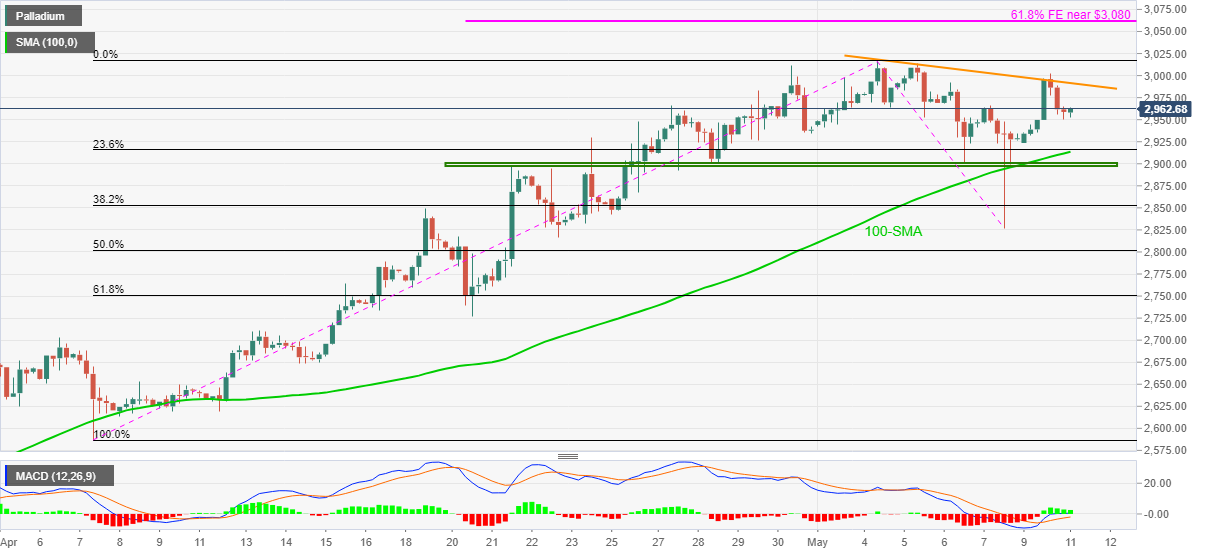
Trend: Bullish
