- WTI picks up bids towards multi-month top flashed the previous day.
- Clear break of over 3.5-year-old horizontal line favor buyers despite sluggish MACD.
- Rising trend line from April 2020 adds to the downside filters.
WTI regains upside momentum near $70.00, up 0.22% intraday amid early Wednesday, following a consolidation near the highest level in 32 months.
Although MACD lines portray sluggish moves inside the overbought area, posing a challenge to the black gold’s further upside, a clear break of horizontal line comprising multiple levels marked since January 2018, near $66.70-60, favor the WTI bulls.
Hence, the commodity prices are ready to regain the $72.00 ahead of challenging highs marked during May and June 2018, respectively around $72.85 and $73.90.
However, any further upside past $74.00 will not hesitate to challenge the 2018 yearly peak surrounding $76.80.
Meanwhile, pullback moves below the stated horizontal line near $66.60 will be tested by a 14-month-old ascending support line, close to $61.80.
Overall, oil prices have recently crossed the key hurdle to the north and hence bulls’ optimism can be justified.
WTI weekly chart
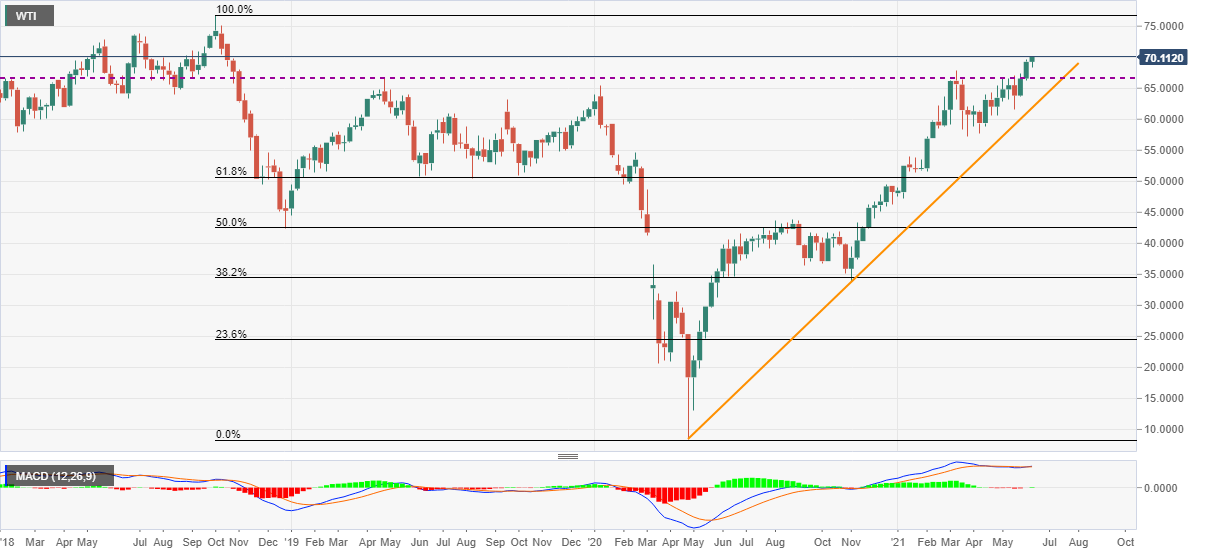
Trend: Bullish
