- Copper posts the heaviest losses in a week inside a bullish chart pattern.
- Sustained trading beyond four-month-old support line favor buyers, MACD signals further pullback.
- Triangle breakout paves the way for fresh record top towards $5.00.
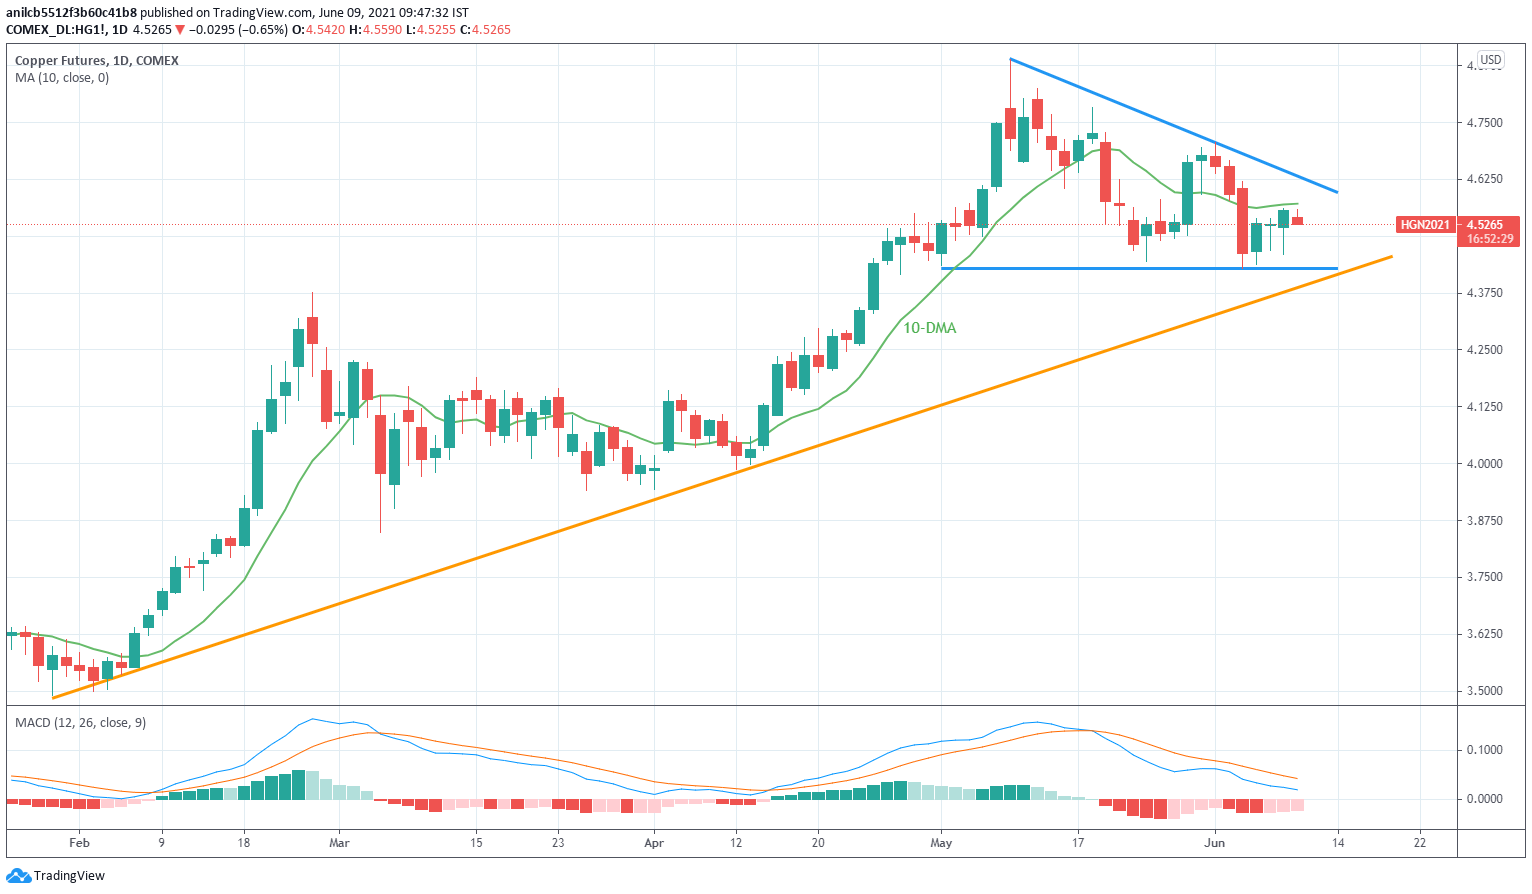
Copper holds lower grounds around intraday low of $4.5255, down 0.60% around $4.5285, ahead of Wednesday’s European session. The red metal’s run-up to refresh the weekly top couldn’t cross the 10-day SMA (DMA), which in turn takes clues from bearish MACD to favor short-term sellers.
The commodity’s latest weakness is likely extending towards the monthly low near $4.4300. Even so, a one-month-old descending triangle and an upward sloping trend line from late January keeps copper buyers hopeful unless the quote breaks $4.3850 levels.
Also acting as the key support is February’s top near $4.3755, breaking which the bears aim for March’s top near $4.2275.
Meanwhile, upside clearance of 10-SMA immediate hurdle, near $4.5720, will need a successful cross of the triangle upper line, close to $4.6400.
Following that, the copper prices could quickly challenge the recent record top near $4.8800 before targeting the $5.0000 psychological magnet.
Price of copper: Daily chart
Trend: Pullback expected
