- DXY struggles for clear direction after posting a bearish candlestick formation.
- 50-DMA adds to the upside barriers, bullish MACD favors buyers.
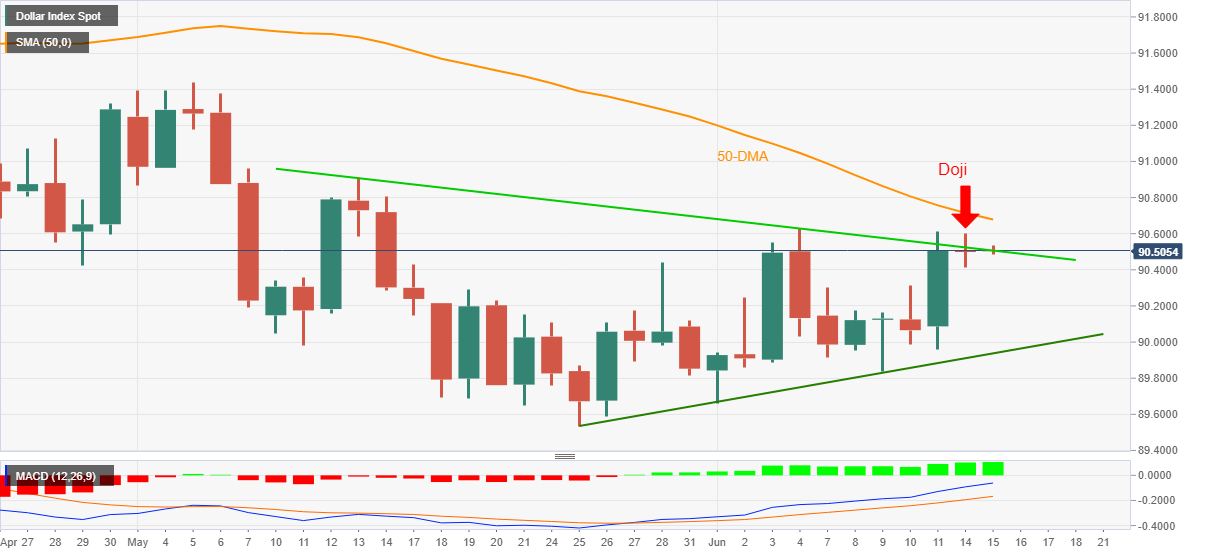
US dollar index (DXY) remains sidelined around 90.51 during Tuesday’s Asian session. In doing so, the greenback gauge seesaws around a one-month-old falling trend line after printing a bearish Doji candlestick the previous day.
It should, however, be noted that bullish MACD and an ascending trend line from May 25 keep buyers hopeful.
Hence, fresh upside needs to cross 50-day SMA (DMA) hurdle near 90.75 to challenge the May 13 top near 90.91 and the previous month’s high surrounding 91.45.
Meanwhile, pullback moves may aim for 90.00 but any further weakness will be questioned by the stated support line near 89.90.
Overall, DXY remains on the bull’s radar but requires confirmation of the further upside.
DXY daily chart
Trend: Pullback expected
