- USD/CAD continues to stay bearish around 1.2600 area.
- The Canadian unemployment data is expected to strengthen the CAD.
- The rise in crude oil prices and falling US yields may also weigh on the USD/CAD
The USD/CAD price fell before major Canadian employment numbers. These numbers are expected to show that the country’s economy created more than 100,000 jobs in August after adding 94,000 jobs in July.
-Are you looking for automated trading? Check our detailed guide-
We expect the unemployment rate to be 7.3% the previous month, slightly below 7.5%. This follows the Bank of Canada’s unchanged interest rates two days earlier. Additionally, the posts appeared in the weeks leading up to the Canadian elections.
As of early Wednesday afternoon, the USD/CAD fell to three-day lows but then showed some resilience below the 1.2600 level.
The risk dynamics on the markets have decreased demand for the US dollar. Additionally, the sharp rise in crude oil prices bolstered the commodity-pegged Canadian dollar and put downward pressure on the USD/CAD pair. As the Fed is expected to announce a cut soon, a strong rally in US Treasury bonds should give a tailwind to the dollar. This should help prevent major bond losses.
The Canadian Jobs Report will be released later in the North American session, so traders may choose to wait on the sidelines. However, it is better to delay positioning until a clear breakdown below 1.2600 has occurred. After that, USD/CAD could sink toward the mid-range of 1.2525-20 and the psychological key of 1.2500.
USD/CAD price technical analysis: Support confluence at 1.2600
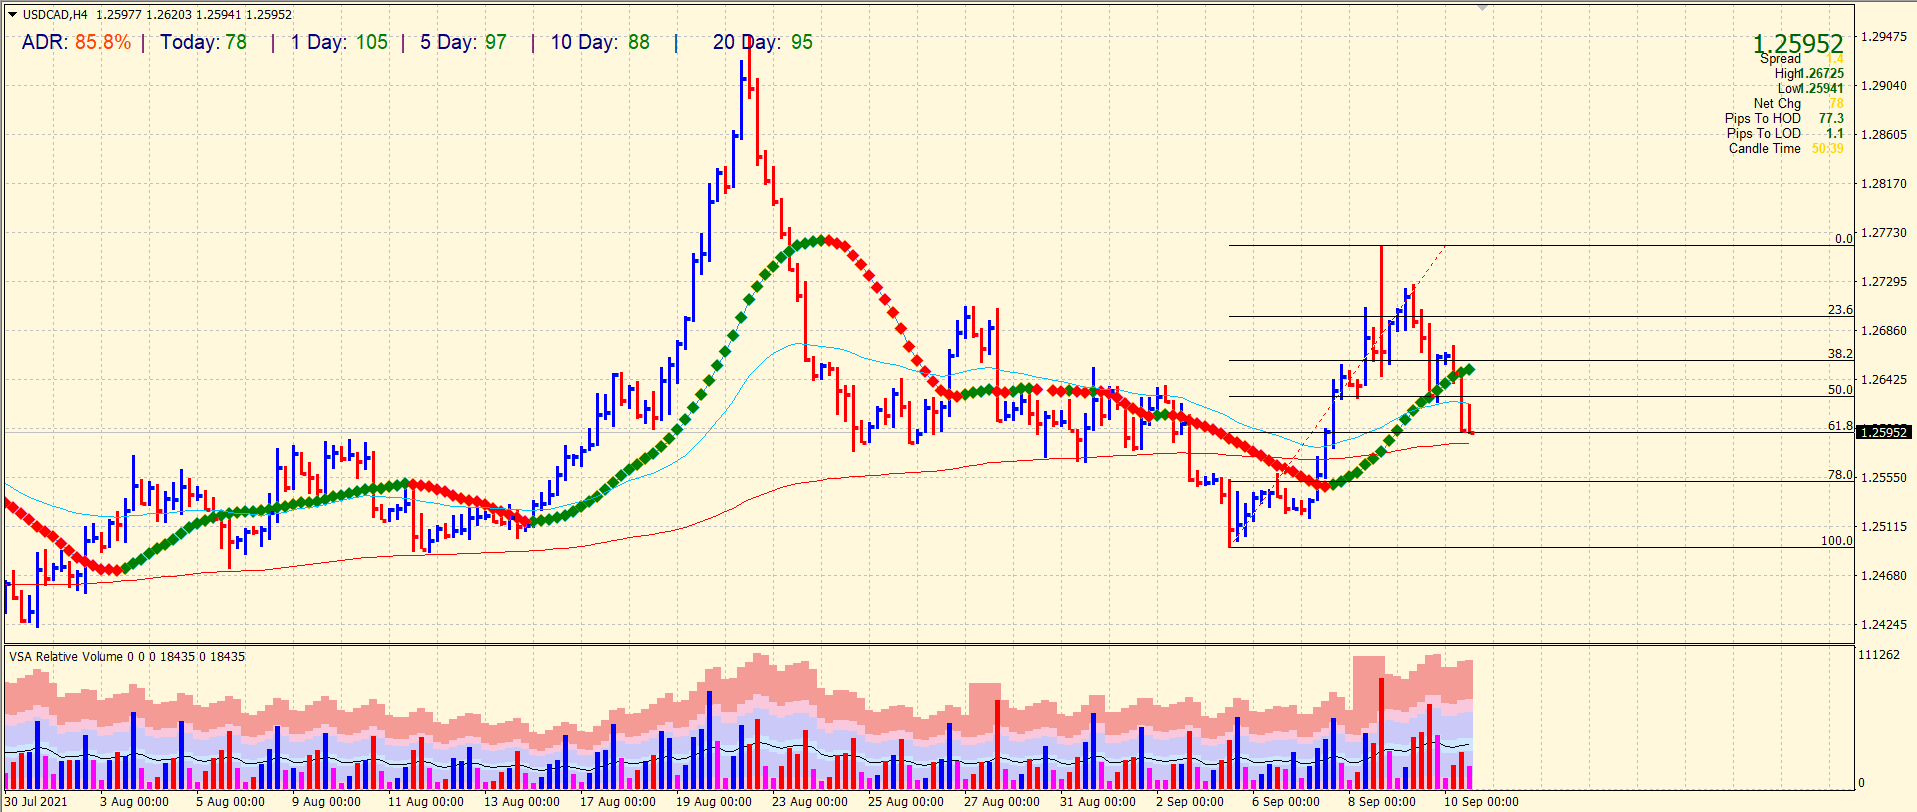
The USD/CAD price breaks below the 20-period and 50-period SMAs. However, the price finds little respite near the 200-period SMA and the key 1.2600 level. The downside move comes with increasing volume, which indicates further losses ahead. The pair has already done 85% of the average daily range. This is an indicator of high volatility on the day. The pair has a tendency to sharply move on either side during the New York session.
-If you are interested in forex day trading then have a read of our guide to getting started-
The 1.2600 support is a confluence of 200-period SMA and 61.8% Fibonacci retracement level as well. Hence, bears will take more strength to break it. Once broken, the price may look for the next level at 1.2550 (78.0% Fibonacci retracement).
Looking to trade forex now? Invest at eToro!
75% of retail investor accounts lose money when trading CFDs with this provider. You should consider whether you can afford to take the high risk of losing your money.
