The Australian dollar rose close to one cent on the week, closing at 0.9170. This week’s highlight is CPI. Here is an outlook of the events and an updated technical analysis for AUD/USD.
AUD/USD jumped sharply after the RBA minutes pointed to some weakening of the central bank’s easing bias. The pair climbed close to the 0.93 line, but could not consolidate and retracted below the 0.92 level.
Updates:
- The chances of a rate cut in August seem higher, and this limits any gains made by the Aussie. AUD/USD is at 0.92 while other currencies are gaining against the US dollar.
- US existing home sales disappoint and fall to 5.08 million (annualized). This triggers another wave of dollar dropping. AUD/USD extends its gains to around 0.9260.
- More: Gold price to turn around?
- The Aussie continues to recover and advance and trades above 0.9250.
- See how to trade the Chinese HSBC manufacturing PMI with AUD/USD.
- The Australian dollar was whipsawed by the almost simultaneous release of both the Australian CPI and Chinese HSBC manufacturing PMI. The former sent the pair as high as 0.9318 but the latter sent it shooting down to 0.9240 before it recovered.
- Video: Where next for EUR/USD, EUR/GBP, GBP/USD, AUD/USD and USD/CAD
- AUD/USD extended its drops and dipped below 0.92 before recovering, falling on a wave of USD strength.
- US New home sales reach 497K – the highest in 5 years – the dollar rises. AUD/USD dips under 0.92.
- The Australian dollar remains weak, and is trading at low ground: 0.9150. This happens while the US dollar is falling, so it’s a bad sign. AUD/NZD has reached new lows.
- Technical analysis: AUDUSD: Bearish, Risk Points To The 0.8997 Level
- The US dollar is sold off towards the end of the week, with no exception. AUD/USD is blocked by 0.93 though.
AUD/USD graph with support and resistance lines on it. Click to enlarge: 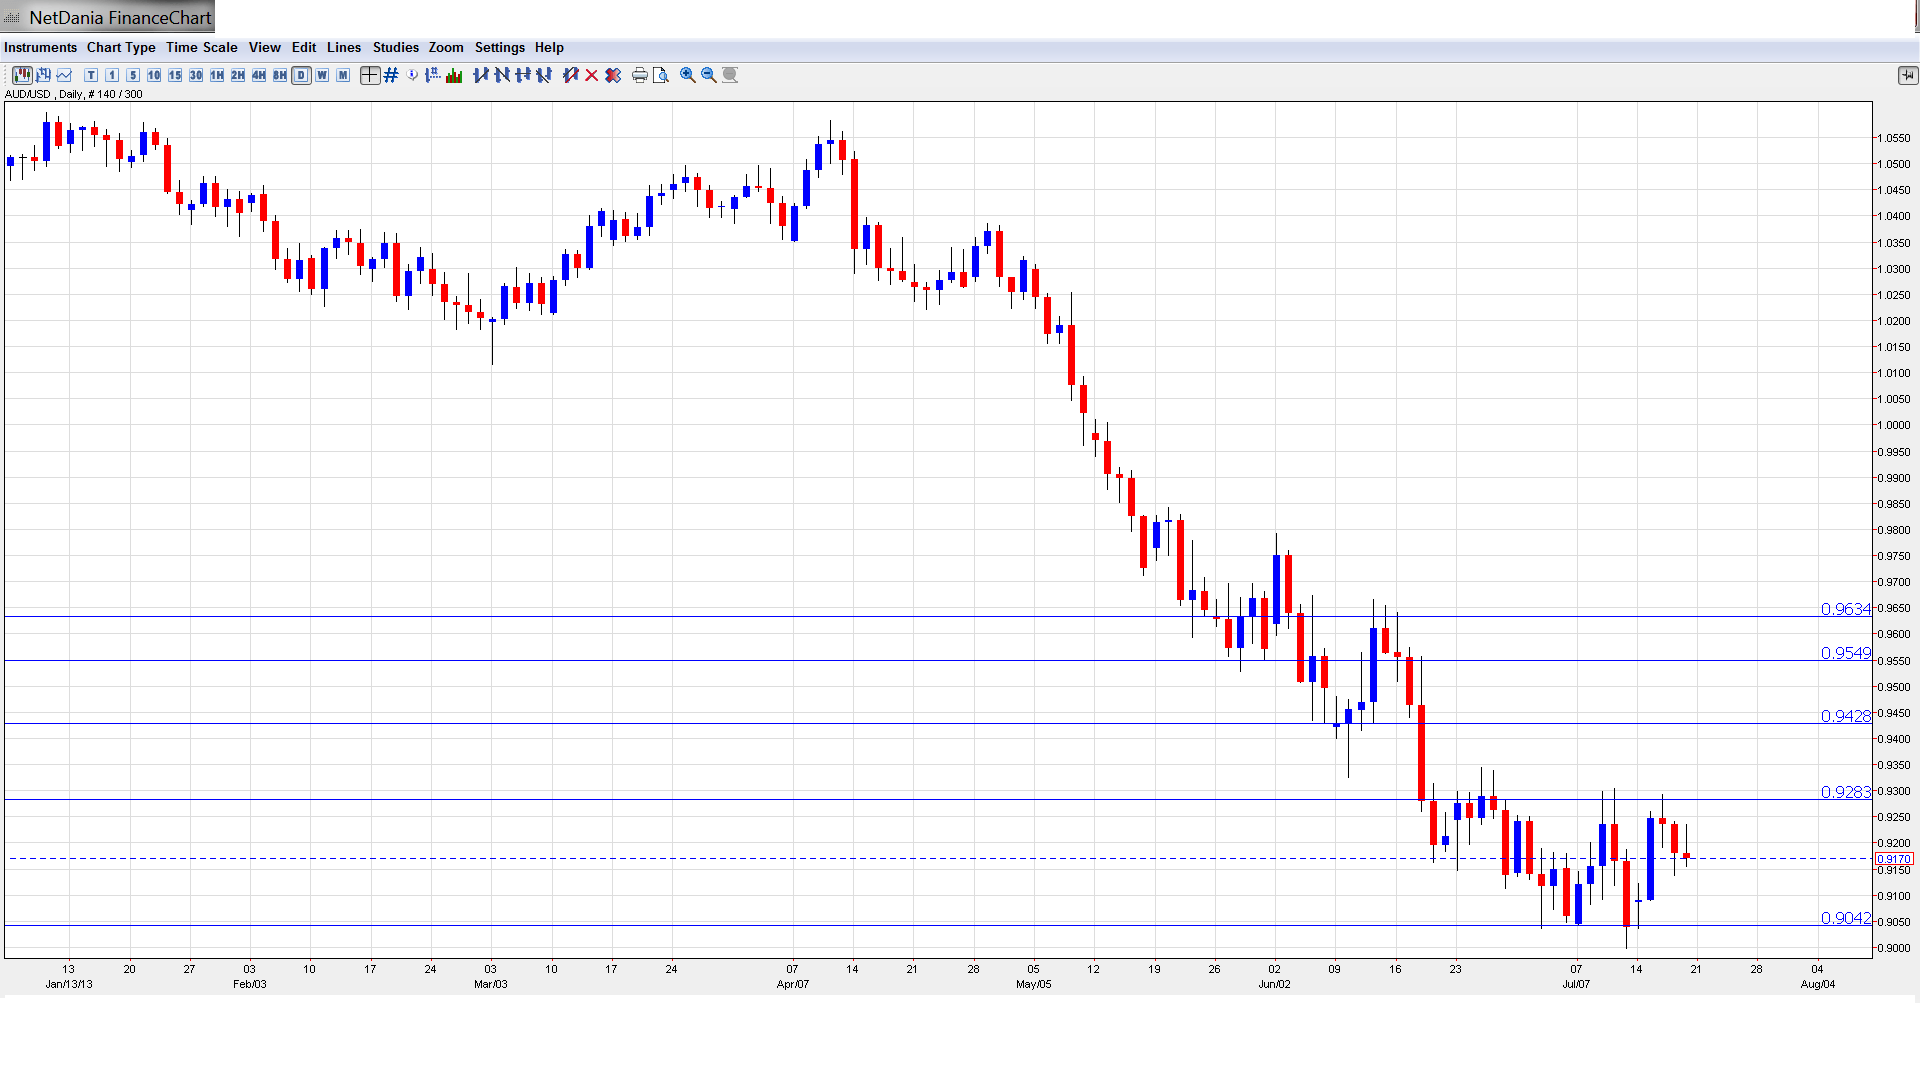
- CPI: Wednesday, 1:30. CPI is the most important consumer inflation indicator, and is released each quarter, magnifying its impact. The Q1 release came in at 0.4%, short of the estimate of 0.7%. The markets are expecting a slight increase in the upcoming reading, with the estimate standing at 0.5%.
- Trimmed Mean CPI: Wednesday, 1:30. This consumer index excludes the most volatile 30% of items which are found in CPI. The RBA uses the Trimmed Mean CPI as part of its calculation for determining inflation. Similar to CPI, this index also fell short of the estimate in Q1. The indicator posted a gain of 0.3%, while the forecast stood at 0.5%. The estimate for the July release is 0.5%.
- Chinese Flash Manufacturing PMI: Wednesday, 1:45. The Manufacturing PMI has fallen for three consecutive readings, underscoring slower growth in the Chinese economy. The previous release came in at 48.3 points, well short of the estimate of 49.4. The markets are not anticipating much change this time around, with an estimate of 48.6 points. The Australian dollar is sensitive to major Chinese releases, so an unexpected reading could affect the movement of AUD/USD.
AUD/USD Technical Analysis
AUD/USD started the week at 0.9090, and after touching a low of 0.9089, moved sharply higher. The pair pushed as high as 0.9292, but then gave up some of these gains, closing the week at 0.9170, just shy of the resistance line at 0.9171 (discussed last week).
Live chart of AUD/USD: [do action=”tradingviews” pair=”AUDUSD” interval=”60″/]
Technical lines from top to bottom:
We start with strong resistance at 0.9634. This line saw some action in mid-June, when the pair started a downward slide in which it dropped below the 0.92 line.
0.9549 is the next line of resistance. This is followed by 0.9428, which had a busy month in June. Prior to that, this line had provided strong support, and had remained intact since October 2011.
0.9283 was briefly breached for the second consecutive week, as the Aussie showed some strength but couldn’t hold onto these gains. This is followed by resistance at 0.9171. AUD/USD ended the week at 0.9170, so this line could see some activity at the start of this week.
0.9041 has been a weak support line for much of July, but has strengthened as the pair gained ground this week. This is followed by the psychologically important 90 level.
0.8893 was last breached in August 2010, as the Australian dollar put together a strong rally which saw it climb above the 1.10 line. This is followed by 0.8747, which has remained in place since July 2010.
0.8550 is the final support line for now. It saw a lot of action in mid-2010 and has remained intact since that time.
I am bearish on AUD/USD.
The Australian dollar flexed some muscle early last week, thanks to the RBA minutes which lessened the likelihood of an interest rate cut. However, Australian data has been less than impressive, and China is also experiencing a slowdown in growth. The Aussie is sensitive to Chinese data, as the Asian giant is Australia’s number one trading partner. So weakness in China could spell bad news for the Australian dollar. Meanwhile, the US posted some strong numbers last week, notably Unemployment Claims. If the US numbers continue to point upwards, the US dollar could post gains against the Aussie.
The Aussie sometimes moves in tandem with gold. You can trade binary options on gold using this technical analysis.
Further reading:
- For a broad view of all the week’s major events worldwide, read the USD outlook.
- For EUR/USD, check out the Euro to Dollar forecast.
- For the Japanese yen, read the USD/JPY forecast.
- For GBP/USD (cable), look into the British Pound forecast.
- For USD/CAD (loonie), check out the Canadian dollar forecast.
