- Kiwi testing into recent resistance that could gas out bidders quickly.
- Hourly technicals are currently mixing around midlines as bearish MACD divergence punches in a third level.
- Little to-do on the Kiwi macroeconomic calendar has left the pair exposed to market sentiment.
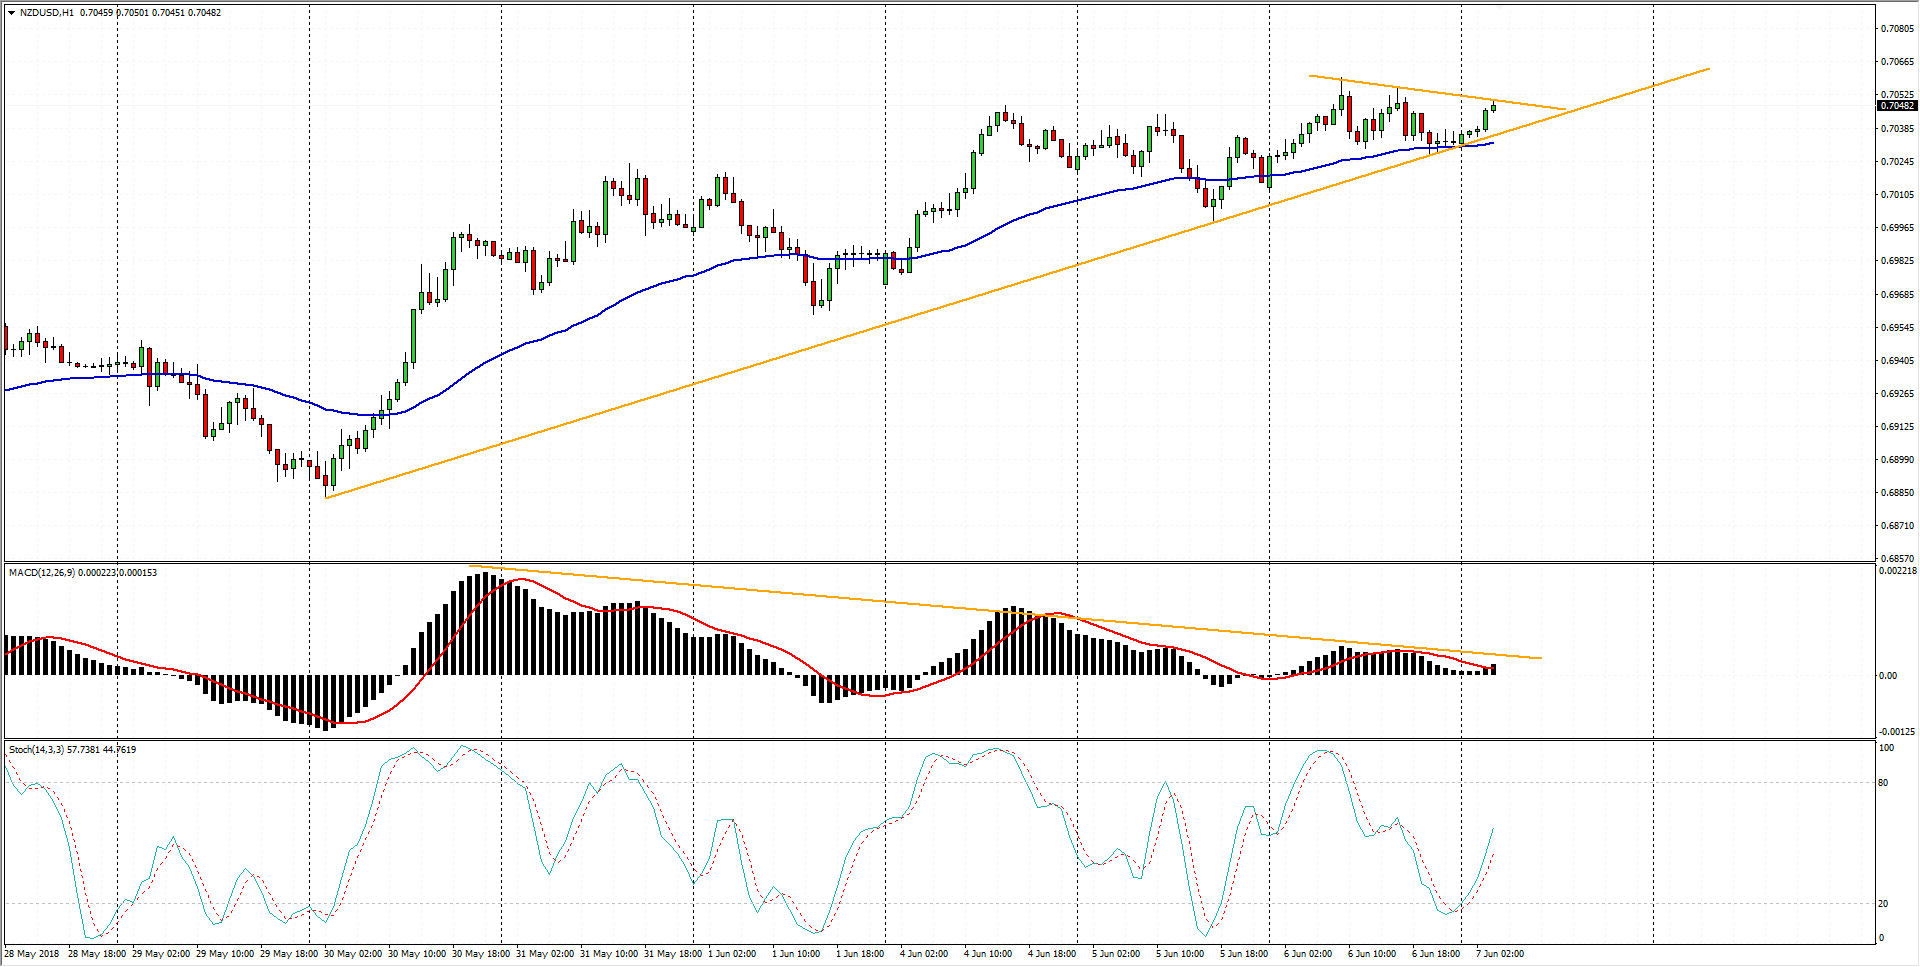
Spot rate: 0.7046
Relative change: 0.19%
High: 0.7050
Low: 0.7031
Trend: Bullish to flat
Support 1: 0.7031 (day’s low)
Support 2: 0.6998 (June 5th low)
Support 3: 0.6972 (current June low)
Resistance 1: 0.7059 (yesterday’s high)
Resistance 2: 0.7099 (R3 1-Day pivot)
Resistance 3: 0.7125 (50% of April-May decline, peak-to-trough)
