“¢ JPY weighed down by fading safe-haven demand and helps bounce off an ascending trend-line support, constituting towards a symmetrical triangular formation on the 1-hourly chart.
“¢ A decisive break through the triangle resistance, currently near the 147.60-65 region, might provide an additional boost, albeit Brexit concerns might keep a lid on any additional strong gains.
“¢ Subsequent up-move is likely to be capped at an important support now turned resistance marked by an upward sloping trend-line, extending from lows touched in August 2017 through March/May 2018 lows.
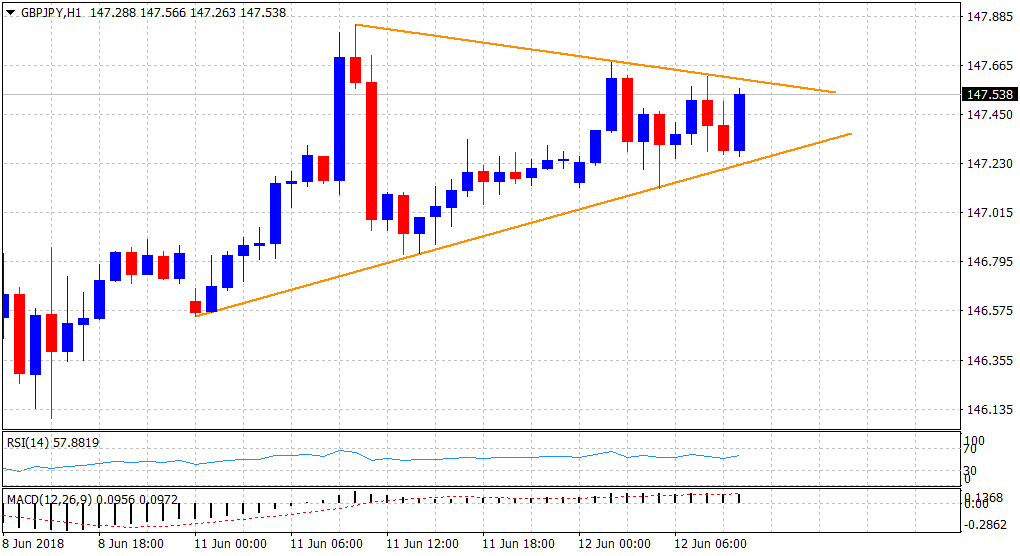
Spot Rate: 147.54
Daily Low: 147.12
Trend: Overall trend remains bearish
Resistance
R1: 148.00 (round figure mark)
R2: 148.35 (trend-line support turned resistance)
R3: 149.06 (50-day SMA)
Support
S1: 147.20 (daily pivot-point)
S2: 146.83 (previous weekly close)
S3: 146.59 (200-period SMA H1)
