“¢ Drops back to challenge an ascending trend-line support, a part of a symmetrical triangular formation on short-term charts.
“¢ A convincing break below the contracting wedge support would open the room for further depreciating move towards a medium-term ascending trend-line support, extending from January 2017 through lows touched in June/December 2017.
“¢ Descending trend-line resistance, also a part of the triangular formation should continue to keep a lid on any meaningful recovery attempt.
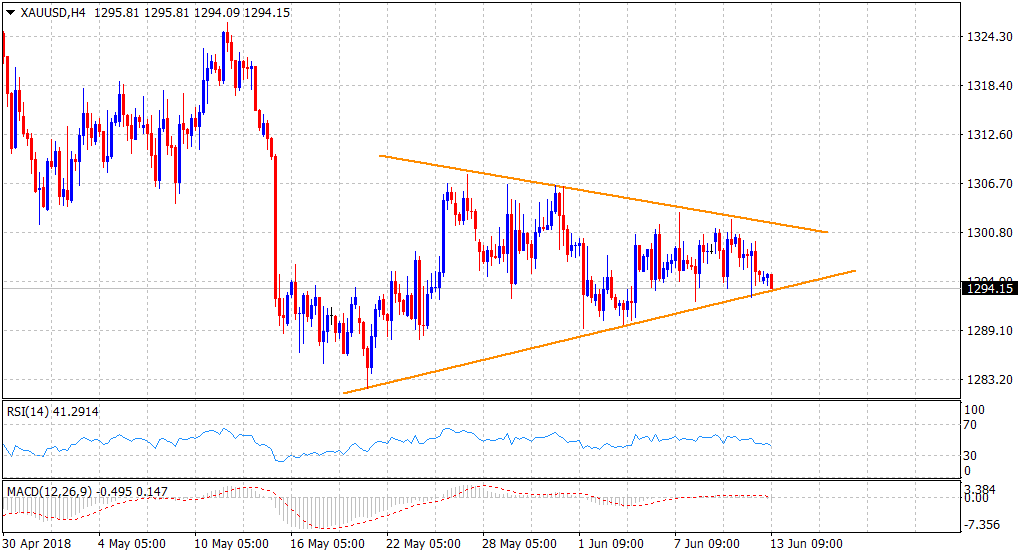
Current Price: $1,294.15
Daily high: $1,296.11
Trend: Bearish below triangle support
Resistance
R1: $1298 (horizontal zone)
R2: $1,302 (descending trend-line hurdle)
R3: $1,307 (200-day SMA)
Support
S1: $1,289 (June 1 low)
S2: $1,282 (May 21 low)
S3: $1,273 (medium-term ascending trend-line)
