- Rising channel remains in-play, though buyers will be looking to jump in closer to the lower boundary.
- Hourly indicators are beginning to rollover in oversold territory.
- Broader sentiment to run the pair with US Retail Sales data quickly following yesterday’s FOMC rate hike of 25 bps.
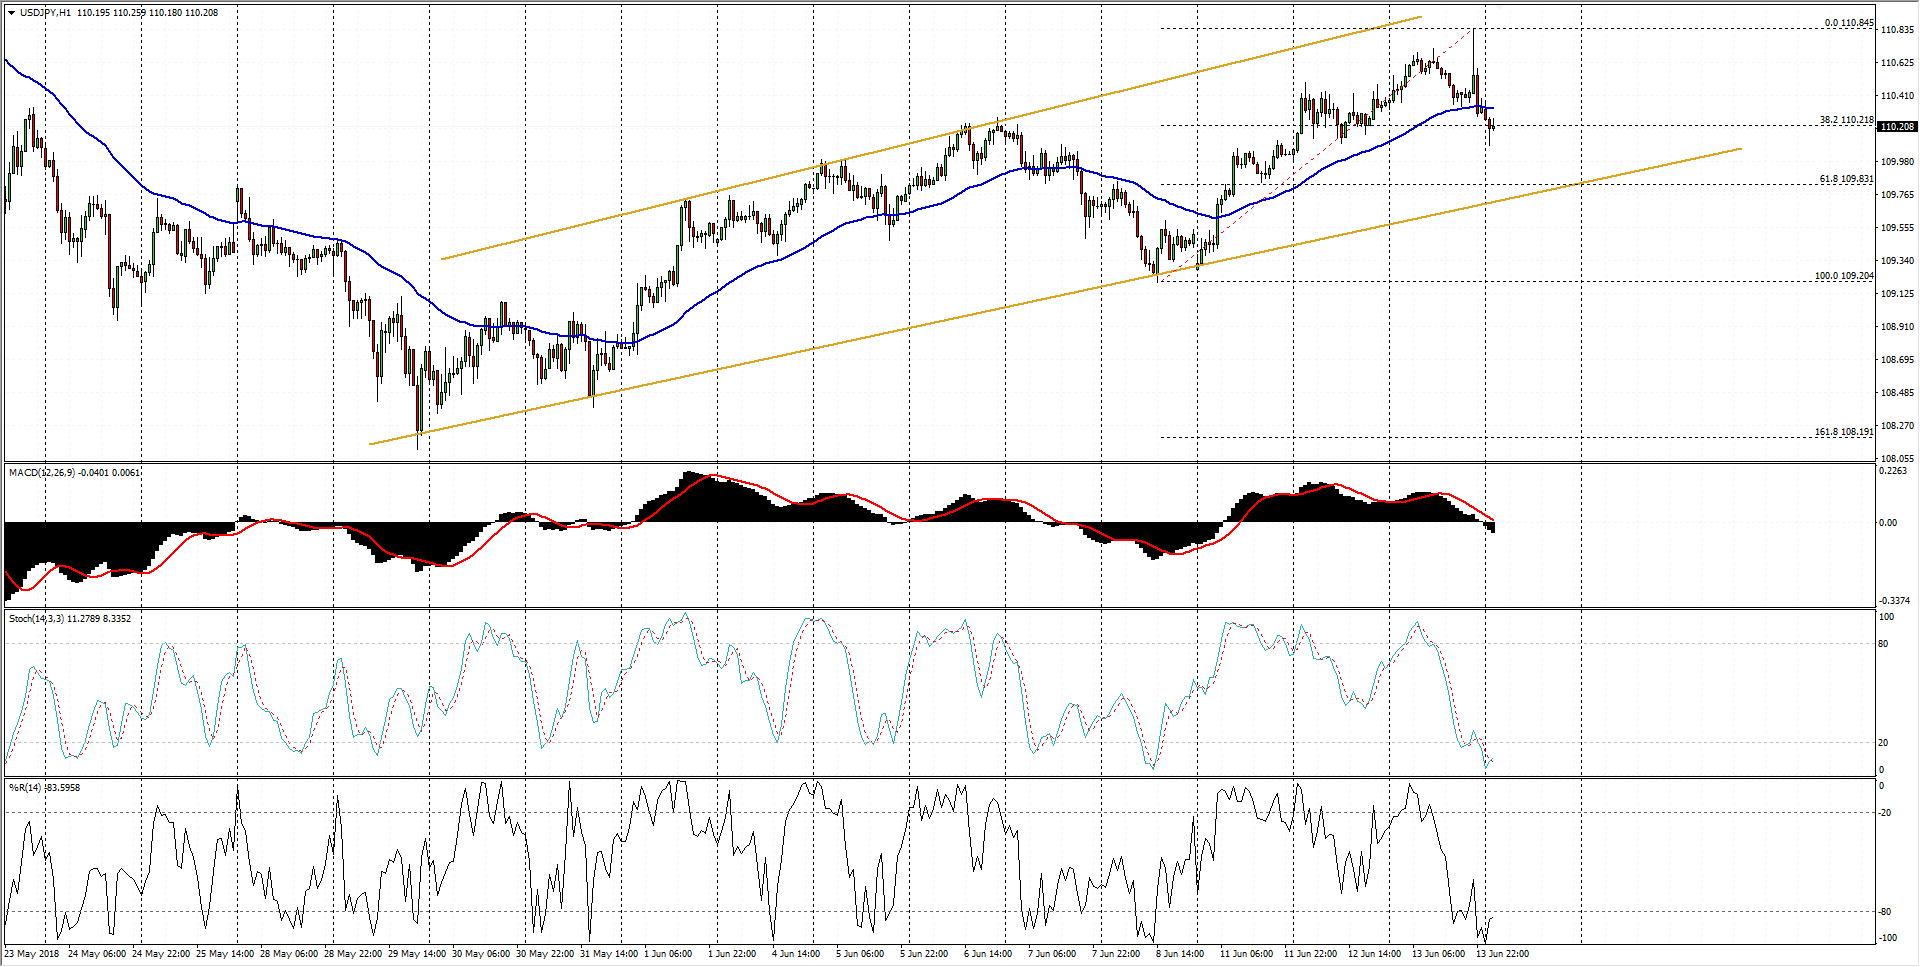
Spot rate: 110.20
Relative change: -0.10%
High: 110.36
Low: 110.08
Trend: Bullish
Support 1: 109.83 (61.8% 1-Week Fibonacci retracement level)
Support 2: 109.20 (current week low)
Support 3: 108.11 (one month low)
Resistance 1: 110.84 (current week high)
Resistance 2: 111.13 (R3 1-Day pivot)
Resistance 3: 111.39 (one month high)
