“¢ Bears challenging an ascending trend-line support, forming a part of a symmetrical triangle on the 1-hourly chart.
“¢ A follow-through selling would signal extension of the prior depreciating slide and open the room for a retest of YTD lows.
“¢ Short-term technical indicators hold in negative territory and further reinforce the bearish outlook.
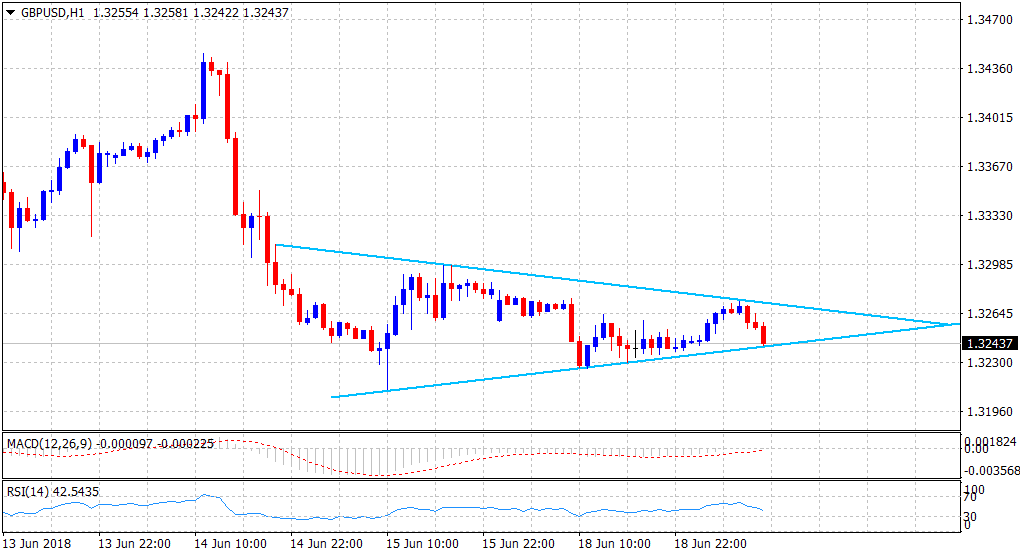
Current Price: 1.3244
Daily High: 1.3273
Trend: Bearish
Resistance
R1: 1.3273 (current day high and triangle resistance)
R2: 1.3300 (round figure mark)
R3: 1.3334 (R3 daily pivot-point)
Support
S1: 1.3219 (S1 daily pivot-point)
S2: 1.3204 (YTD low set on May 29)
S3: 1.3170 (horizontal level)
