“¢ Attempted recovery alongside an ascending trend-channel seems to have formed a bearish flag chart pattern on the 1-hourly chart.
“¢ A convincing break below the channel support would expose a medium-term ascending trend-line, extending from Jan. 2017 lows through lows touched in July/Dec. 2017.
“¢ On the same chart, short-term technical indicators have recovered from near-term oversold conditions but haven’t been supportive of any additional gains.
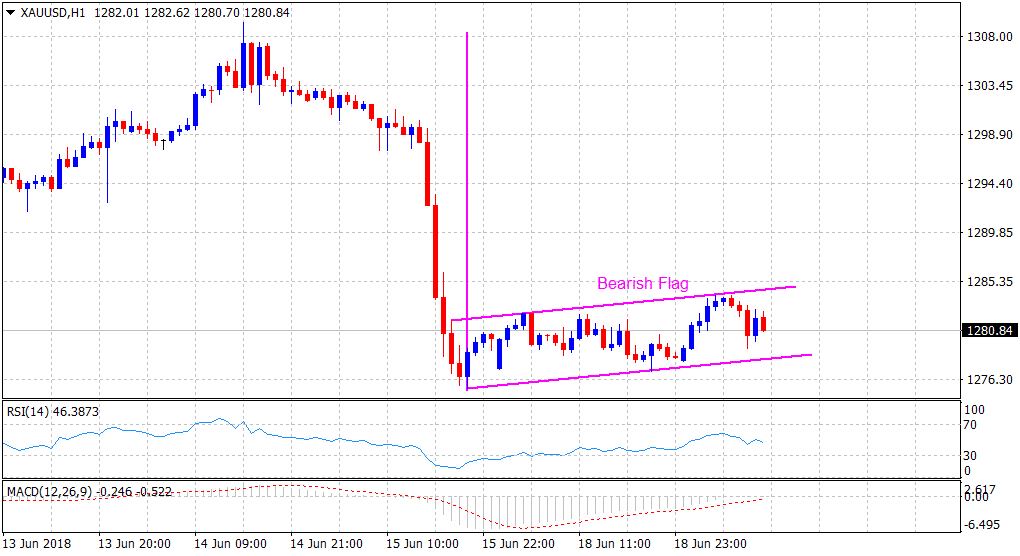
Current Price: $1280.84
Daily High: $1284.09
Daily Low: $1277.99
Trend: Bearish
Resistance
R1: $1284.40 (trend-channel resistance)
R2: $1289.38 (previous monthly swing low set on June 1st)
R3: $1296 (horizontal zone)
Support
S1: $1278 (trend-channel support)
S2: $1275.48 (YTD lows set last Friday)
S3: $1268.50 (medium-term ascending trend-line)
