Home GBP/USD Technical Analysis: Cable bounces from daily lows, currently capped at 1.3240
FXStreet News

GBP/USD Technical Analysis: Cable bounces from daily lows, currently capped at 1.3240

  • GBP/USD bounced after it tested the 1.3200 figure. It is now finding some resistance near the 1.3240 level, the 50-period simple moving average of the 15-minute chart.
  • GBP/USD keeps a bearish bias as long as it stays below 1.3260, the 200-period SMA.  
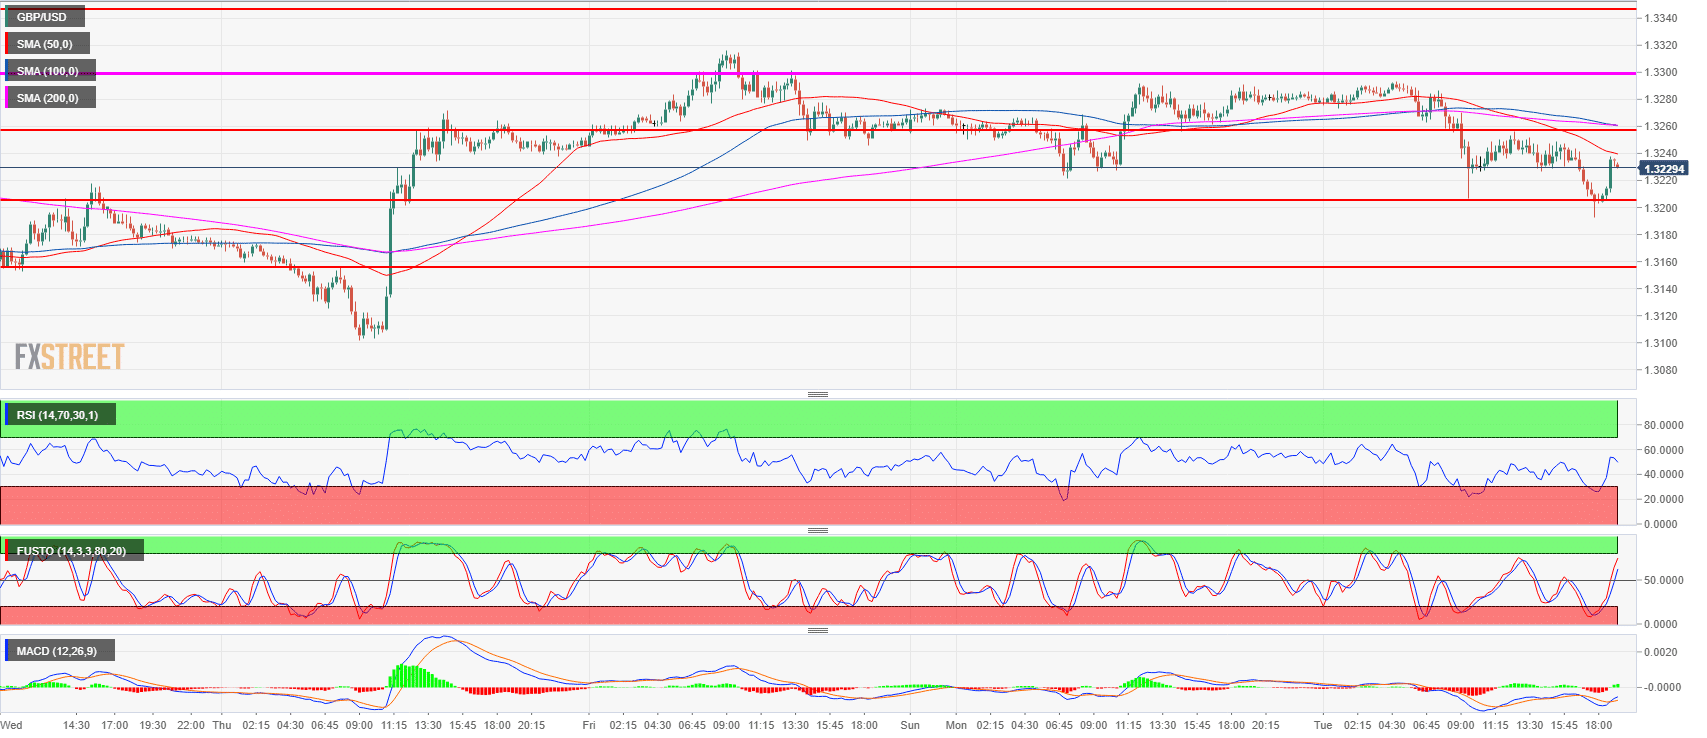
GBP/USD 15-minute chart

Spot rate:               1.3229
Relative change:    -0.38%      
High:                      1.3293
Low:                       1.3192

Trend:                    Bearish

Resistance 1:        1.3240, 50-period SMA (15m)
Resistance 2:        1.3260, 200-period SMA (15m)
Resistance 3:        1.3300 key support    
Resistance 4:        1.3350 supply/demand level

Support 1:             1.3200 figure
Support 2:             1.3155 breakout point
Support 3:             1.3146, current 2018 low

FX Street

FX Street

FXStreet is the leading independent portal dedicated to the Foreign Exchange (Forex) market. It was launched in 2000 and the portal has always been proud of their unyielding commitment to provide objective and unbiased information, to enable their users to take better and more confident decisions.