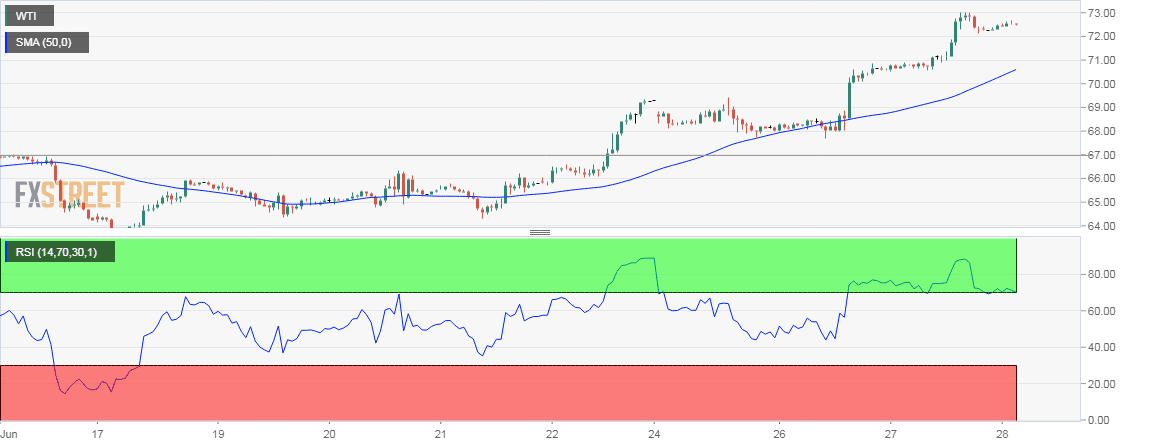
- Oil rose to a 3.5-year high of $73.05 yesterday – the highest since November 2015, but looks overbought as per the relative strength index (RSI) on the hourly chart. The RSI on the 4-hour chart is also flashing overbought conditions.
- A minor pullback could be in the offing.
Hourly chart
Current Price: $72.57
Daily High: $72.65
Daily Low: $72.42
Trend: Bullish, but minor pullback likely
R1: $72.79 (R2:1W)
R2: $73.05 (previous day’s high)
R3: $74.89 (R2-1M)
Support
S1: $72.26 (S1-D1)
S2: $72.20 (S2-D2)
S3: $72.13 (S3-D3)
