- The hourly chart shows a double top bearish reversal pattern and a bearish price-relative strength index (RSI) divergence.
- It indicates the rally from the low of 1.5275 (June 4) has ended and a pullback could be seen.
- The pair could test key rising trendline support.
Hourly chart
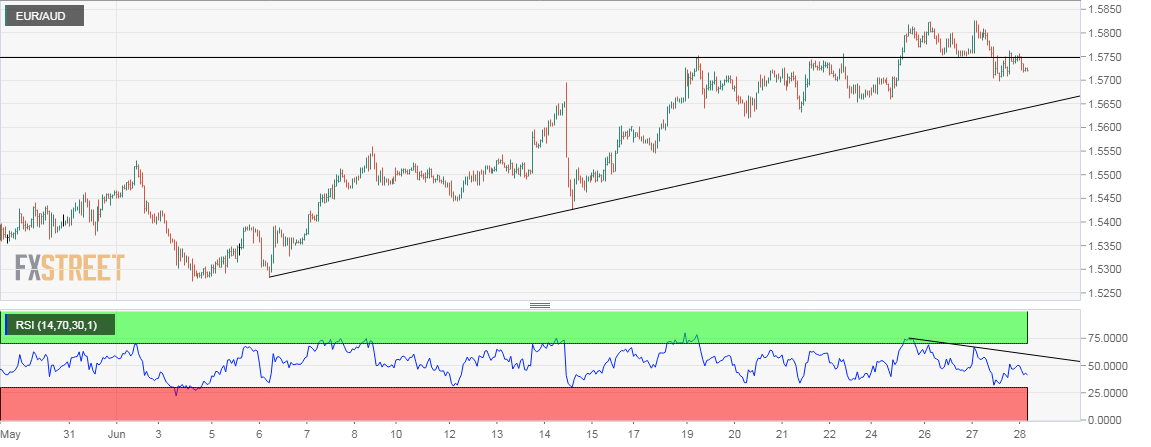
Spot Rate: 1.5720
Daily High: 1.5756
Daily Low: 1.5715
Trend: Bearish
R1: 1.5756
R2: 1.58 (psychological hurdle)
R3: 1.5826 (June 27 high)
Support
S1: 1.5696 (23.6% Fib R of June 4 low – June 27 high)
S2: 1.5619 (June 20 low)
S3: 1.5550 (50% Fib R of recent rally)
