- GBP/USD is up about 130 pips this Friday and is now testing the 1.3200 figure.
- Although the main trend is bearish the current correction is rather strong and some bullishness might persist in the coming days especially if GBP/USD trades above 1.3200.
- Resistances to the upside are seen near 1.3256, intraday swing high from Tuesday and 1.3300 figure.
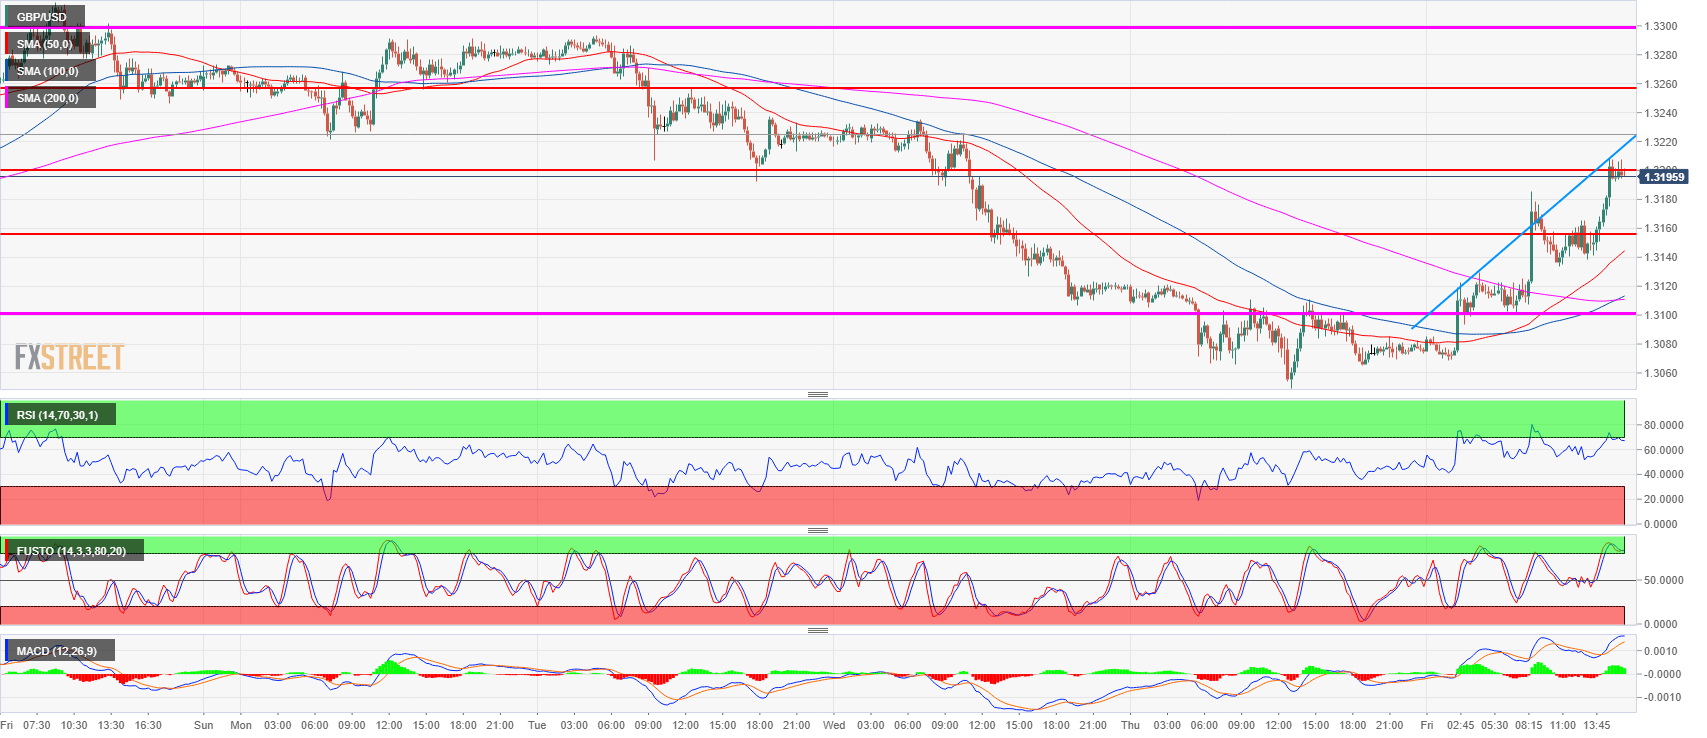
Spot rate: 1.3197
Relative change: 0.91%
High: 1.3208
Low: 1.3068
Trend: Bullish short-term
Resistance 1: 1.3200 figure
Resistance 2: 1.3256, intraday swing high Tuesday
Resistance 3: 1.3300 figure
Support 1: 1.3155 former breakout point
Support 2: 1.3100 figure
Support 3: 1.3049 current 2018 low
Support 4: 1.3027 October 6, 2017 swing low
Support 5: 1.2774, August 24, 2017 swing low
