- The EUR/JPY chart shows a bearish price-relative strength index (RSI) divergence.
- Acceptance below 129.07 (neckline support) would confirm a double top reversal and open up downside towards 128.67.
Hourly chart
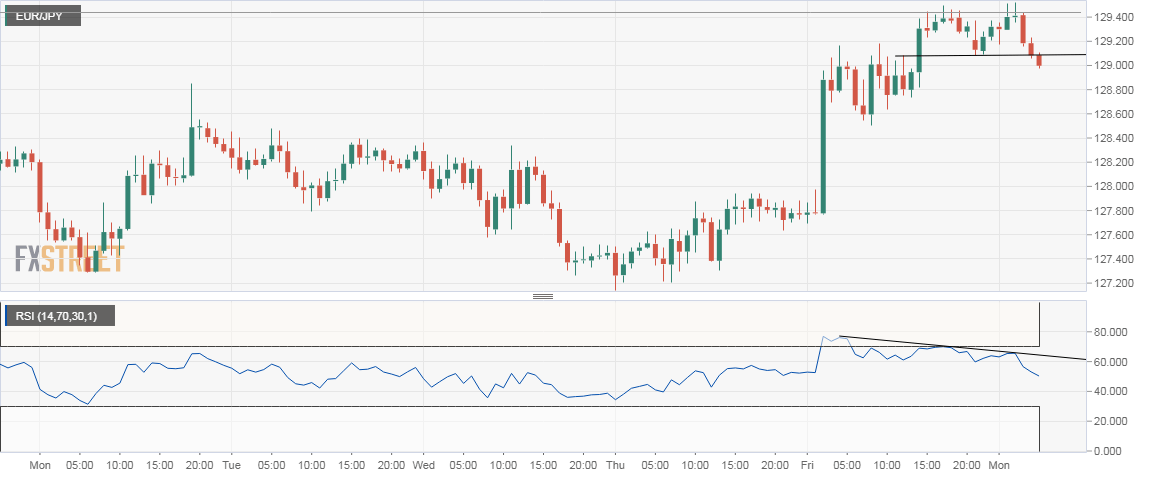
Spot Rate: 129.04
Daily High: 129.50
Daily Low: 129.04
Trend: Pullback in the offing
R1: 129.50 (session high)
R2: 130.00 (psychological level)
R3: 130.45 (100-day moving average)
Support
S1: 129.67 (double top breakdown target)
S2: 128.12 (10-day moving average)
S3: 127.65 (previous day’s low)
