“¢ Friday’s modest recovery attempts failed ahead of 100-hour SMA, with a goodish pickup in the USD demand prompting some fresh selling at the start of a new trading week.
“¢ The formation of a downward sloping trend-channel on the 1-hourly chart clearly seems to suggest that the near-term bearish trajectory might still be far from over.
“¢ Given that short-term technical indicators are holding in neutral territory, the commodity’s inability to benefit from reviving safe-haven demand further reinforces the negative outlook.
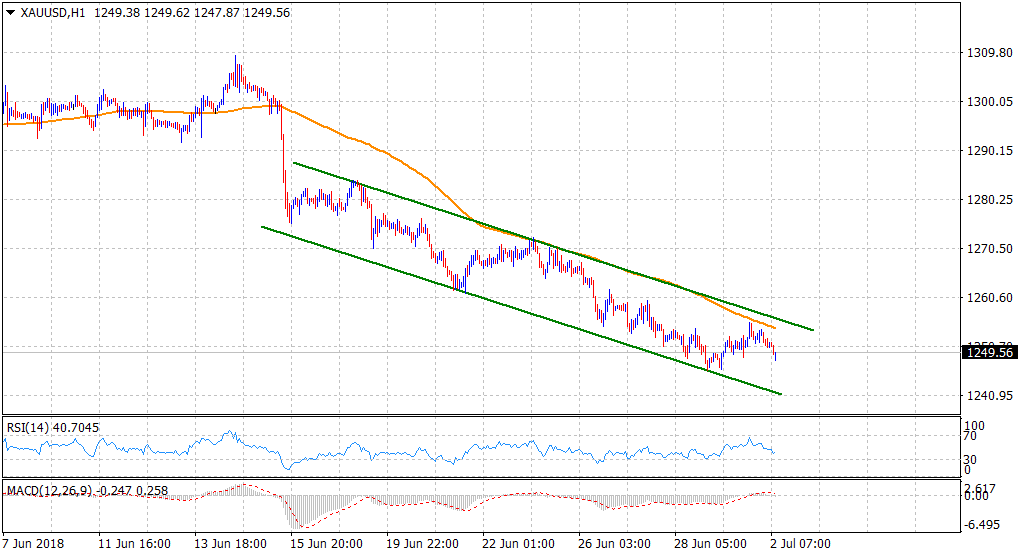
Spot Rate: $1249.56
Daily Low: $1247.87
Daily High: $1254.23
Trend: Bearish
Resistance
R1: $1255.66 (descending trend-channel hurdle)
R2: $1260.53 (10-day SMA)
R3: $1272.60 (last week’s swing high)
Support
S1: $1245.98 (multi-month low set last Thursday)
S2: $1241 (descending trend-channel support)
S3: $1236.52 (Dec. 12, 2017 swing low)
