- GBP/USD gained about 50 pips on Tuesday and found some resistance near the 1.3200 figure.
- A failure to break above 1.3200 can lead to a rotation back towards 1.3155 former breakout point and the 1.3100 figure.
- On the flip side if bears can overcome 1.3200 it can lead to a move towards 1.3256, intraday swing high of last Tuesday.
GBP/USD 15-minute chart
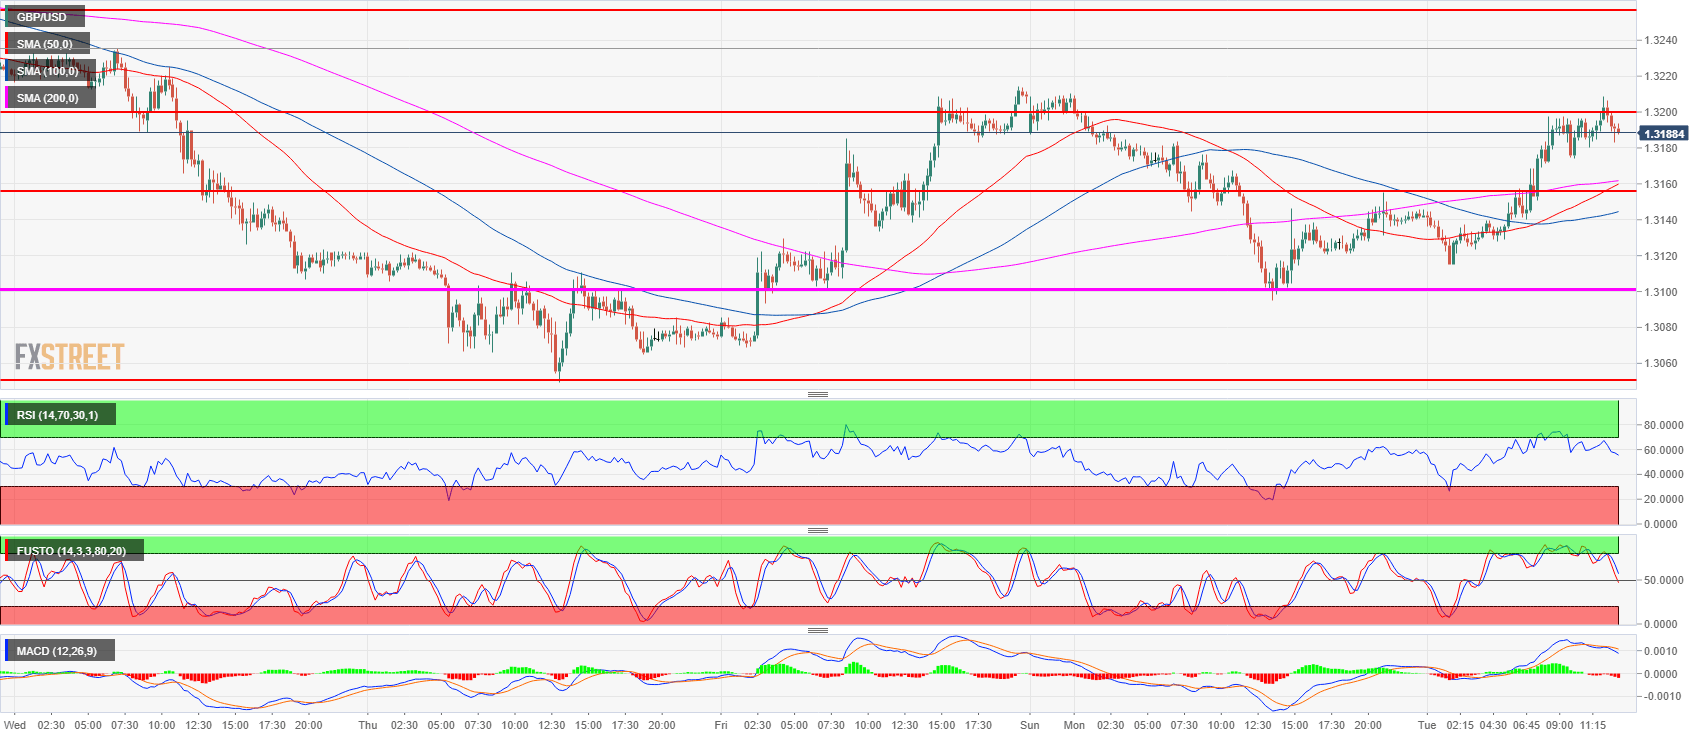
Spot rate: 1.3190
Relative change: 0.34%
High: 1.3208
Low: 1.3114
Trend: Bearish
Resistance 1: 1.3200 figure
Resistance 2: 1.3256, intraday swing high of last Tuesday
Resistance 3: 1.3300 figure
Support 1: 1.3155 former breakout point
Support 2: 1.3100 figure
Support 3: 1.3049 current 2018 low
Support 4: 1.3027 October 6, 2017 swing low
