“¢ Repeated failure from the vicinity of parity mark has been finding support near an ascending trend-line, extending from lows touched in April and twice in June.
“¢ The combination of horizontal resistance and ascending trend-line support now seems to constitute towards forming an ascending triangle on the daily chart.
“¢ The fact that the pair remains comfortably above medium/long-term moving averages (100 & 200-day SMA) further reinforces the bullish formation.
“¢ Short-term technical indicators hold in neutral territory and hence, it would prudent to wait for a decisive break in either direction before positioning for the near-term trajectory.
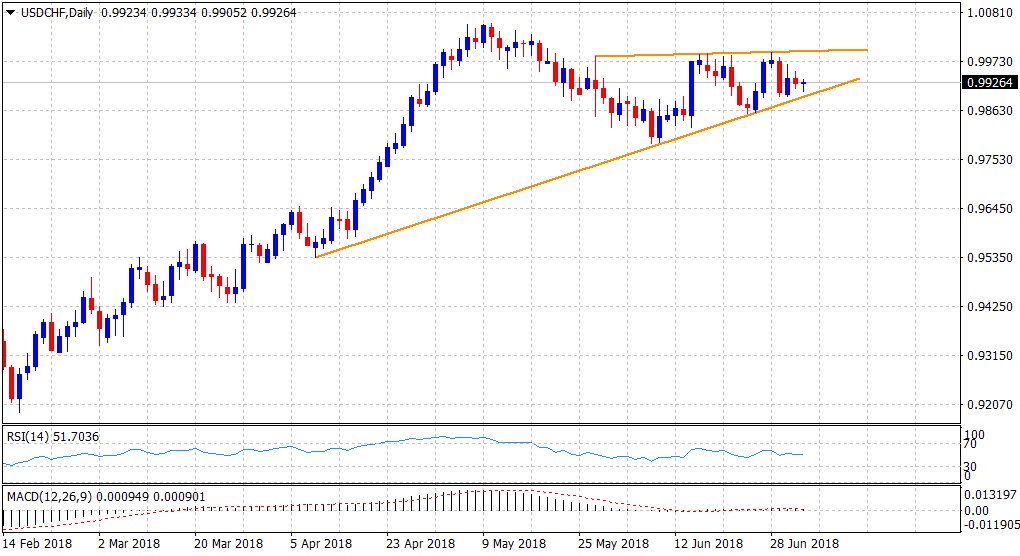
Spot Rate: 0.9926
Daily High: 0.9933
Daily Low: 0.9905
Trend: Bullish
Resistance
R1: 0.9966 (weekly high)
R2: 0.9988 (R3 daily pivot-point)
R3: 0.9996 (horizontal zone)
Support
S1: 0.9889 (ascending trend-line)
S2: 0.9868 (S3 daily pivot-point)
S3: 0.9826 (June 14 swing low)
