- GBP/USD keeps grinding higher as bulls are pushing prices near the 1.3300 level as the week is coming to an end.
- GBP/USD is also testing 1.3284, the 200-period simple moving average on the 4-hour chart. GBP/USD has not traded above its 200-period SMA since April, 20. A breakout above the level can be seen as a bullish clue.
GBP/USD 15-minute chart
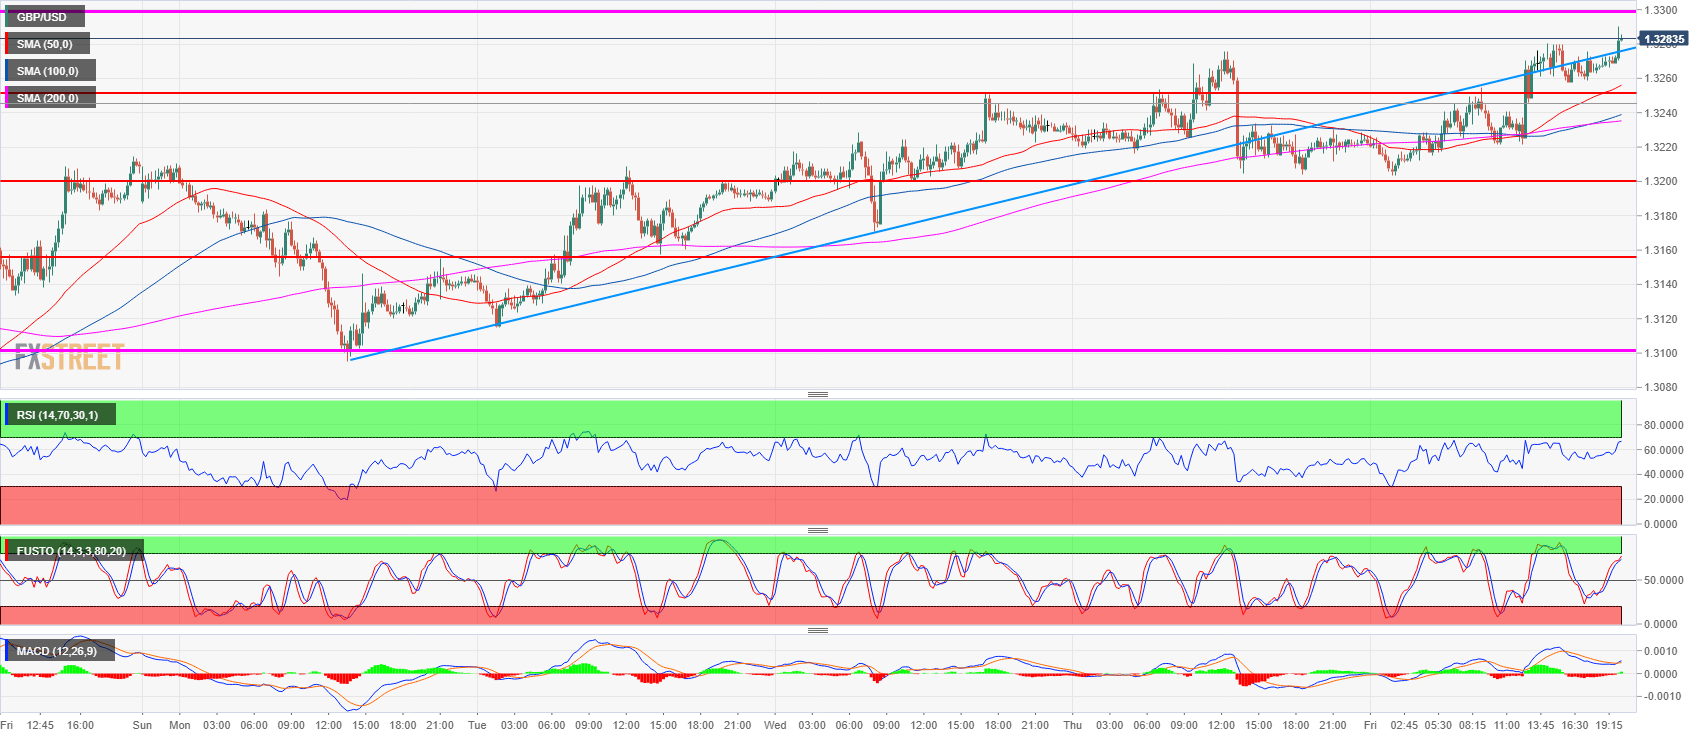
Spot rate: 1.3283
Relative change: 0.44%
High: 1.3290
Low: 1.3203
Trend: Bullish
Resistance 1: 1.3284, 200-period SMA (4h)
Resistance 2: 1.3300-1.3314 June 22 swing high
Resistance 3: 1.3400 figure
Support 1: 1.3250 Wednesday’s high
Support 2: 1.3200 figure
Support 3: 1.3155 former breakout point
Support 4: 1.3100 figure
Support 5: 1.3049 current 2018 low
Support 6: 1.3027 October 6, 2017 swing low
GBP/USD 4-hour chart and the 200-period SMA

